Author / Industry Experts
Updated 10 Sep, 2024

Sign up to get the latest news and developments in technology, business analytics, data science and Polestar Analytics
At a point in time, where you can learn anything within a few hours by watching videos, we're calling this guide the 'Ultimate Power BI guide' - because we've included a few things that aren’t possible to learn in just a few hours. With our experts, we've curated this PowerBI guide for you to understand all there is right from choosing the right Power BI license to even designing the best dashboards.
Caution: Power BI Ahead! (Proceed at Your Own Risk) Prepare to become a data overlord and make your Excel-loving colleagues green with envy
For your ease we've curated the entire page into an easy downloadable Power BI Guide
Take a look
Of all the questions we answer as Power BI implementation partners, the most asked one is that why should we upgrade if Power BI desktop is free? While it is true that creating reports is free with Power BI Desktop (Now Microsoft Fabric free account), Microsoft charges for:
For a detailed breakdown of these features, it’s best to refer to a Power BI Guide that highlights the differences between the free and premium offerings.
So, if you want to leverage Power BI beyond personal use i.e. create dashboards for larger datasets, use their robust tools, and share it with others, then you might have to choose between Power BI Pro, Power BI Premium, Power BI Embedded or any of the Microsoft Fabric types (which has Power BI included in it).
For a deeper understanding of these options, you can refer to a Power BI guide to determine which one best fits your needs.
P.S. You are charged for the capacity and the users i.e. user based - paid as per the number of users or capacity based - paid as per the capacity nodes. It is calculated by:
Capacity Units: These are the dedicated set of resources reserved to handle various workloads. It denotes the computational power available for your chosen capacity.
v-cores or Virtual Cores: Changed after 2022, the unified v-cores represents the virtual cores assigned to the capacities in both front and back end.
To fully navigate these choices, a Power BI guide can provide the clarity needed for optimal selection. Additionally, exploring a Power BI guide will help you understand the key differences between the pricing models.
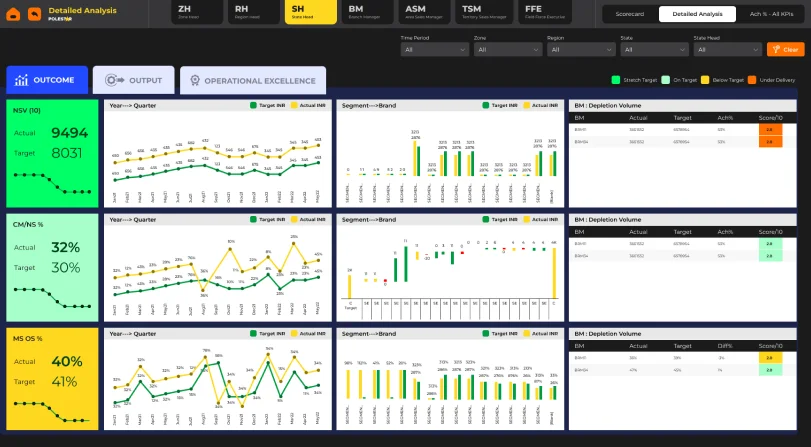
We'll elaborate more on this in just a while. For now, your goal might be to create a dashboard like this:

Power BI Dashboard Sample: A Commercial Dashboard for Sales Users
And to create this with the best possible implementation processes. That's what we aim to do today.
So let's get into it!

Types of Power BI licenses
After the addition of Fabric SKUs, there are now 4 types of SKUs, you might come across while dealing with Power BI namely: EM, A, P, (collectively Microsoft SKUs) and F (Azure SKUs) type. You might need to select an SKU based on the type of you solution you want deployed out of Power BI Pro, Power BI Premium, Power BI Embedded or Microsoft Fabric.
The details of these SKUs and their differences are also discussed in our Power BI guide in detail, which will help you choose the right one for your specific needs.
For both Premium per capacity and Embedded users (i.e. all the SKUs we mentioned above), the pricing is usually dependent on the number of cores and capacity units you need.

Revamp your organizational intelligence with the best BI tool for your visualizations
Choosing between the licenses - What's right for you
Every license has a different driver and use. Power BI free is for someone who's trying to get started with it. Pro is for the teams who want to start sharing their reports, Premium per user for teams who want to share larger datasets extensively and Premium per capacity is when you want more capabilities like larger data limits, storage,etc.
Power BI embedded is useful when you want to share your Power BI app access to external users or large set of audience without having to buy many Power BI licenses. Understanding these different options is crucial, and a Power BI guide can serve as a useful resource to help you make the right choice for your organization. The gist is summarized below:

Well, now you must have decided on the type of license you would need. Next what?
How should the Power BI implementation be? With our Agile implementation framework, we make sure that Power BI is integrated while ensuring enough 'change' practices, as outlined in our Power BI guide for a seamless transition and adoption.

Congratulations for taking a step towards building a data culture in your organization with Power BI. You might be at a place where you want to know how to get started with Power BI or Microsoft Fabric. Then this can be your compass to direct you on a path to be taken. Though we’re labelling it the first 100 days, this is an approximation – the actual number of days would be decided based on the complexity of implementation you would need. We’ll walk you through this using our Power BI implementation plan, structured around a 6-step agile framework, as detailed in our Power BI guide.
Agile is not just a framework- it is an attitude. Getting started with it needs dedication and adherence to the 'change'. It is due to a lack of such processes that upto 87% of analytics projects fail.
Our 6-step Agile frame work as you can see in the image, is broken down into:
Let's discuss the gist of these steps and how we start with them next.
The 6-step agile Power BI implementation roadmap
Catch our the entire framework here
Maturity levels in Organizational adoption
Usually, it is difficult to measure where you stand and where do you want to move forward. But with Power BI adoption with the below levels, you can clearly understand where you stand.
This can help you pave the way forward to create a data-driven organization. But remember, data analytics or data visualization is a marathon - by breaking it down into sprints, you can make it seem easier and achievable, as you will find in our Power BI guide to help you navigate the journey.

Want to take your existing Power BI capabilities up a notch with better advisory & training

Stories are everywhere.
Be it watching something on the news or reading it in a book or telling your own one. We listen to them every day. But what makes these stories compelling?
The Data, The Narrative, and The Visuals
Depending on whether the data is categorical, ordinal, or continuous you'll need to think about representing data in different fashion. For guidance on how to do this effectively, refer to our Power BI guide.
You'd want the narrative to have a:
Building a compelling narrative: Here's a cheat sheet for finding how it would work best
X-dimension is the purpose of communication and the Y-dimension talks about the level of interactivity of the audience.
Most of the dashboards that we make for the audience be it internal or external fall under informative purpose as their aim is to primarily convey information or create data-driven insights. Whereas persuasive visuals are to influence the audience behaviours.
The matrix can serve as a starting point for understanding the different types of visual communication based on their purpose and interactivity level.
Choosing the right Power BI chart type for your dashboard:
To understand what kind of charts to use you'll need to think about the data and how you want to represent it. Some of the questions that would help:
The additional parameters that would be needed to consider in addition is how you want to represent the data as explained in our Power BI guide, like the ones below:
Dashboard-ing and Data Storytelling best Practices
We've covered in detail about the methods, the processes, what to do and what not to do w.r.t. dashboards and data visualization in our ebook, you can check it out to know more. Now let's take look at the best practices for data storytelling & visualization.
Also, though most people love pie chars and bar charts, it don't fall into the 'conundrum' of using them repeatedly, you can look at the alternatives to represent data better , a concept further explained in our Power BI guide to elevate your visualizations.

Whatever it is that you need, our Microsoft experts are here to integrate your Power BI into workflows
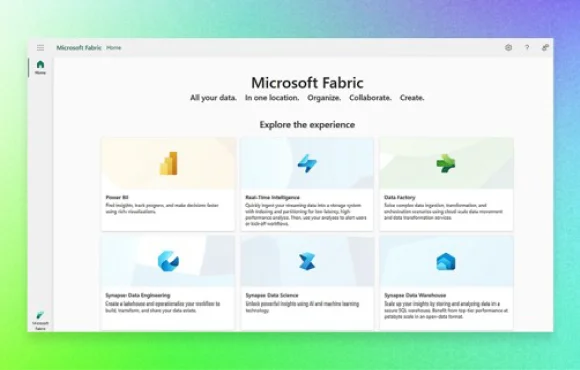
We've made the dashboards.. But facing data integration challenges? If this is a question that is on your mind now or you think would come later. Microsoft has a solution for you.. Fabric
 Taking Power BI to the nextlevel with Microsoft Fabric
Microsoft Fabric serves as an all-in-one analytics platform that combines multiple of its existing services like Azure Data Factory, Synapse Analytics, and Power BI with new services like Data Activator and One Lake.
What's the benefit this would provide?
Some of the benefits include: access to a unified data platform, centralized data repository with OneLake, integration with Azure Open AI services (Co-pilot), user-friendly integrations, reduced costs due to reduced tech stack maintenance, etc. According to the Projected Total Economic Impact™ Of Microsoft Fabric, a commissioned study conducted by Forrester Consulting, the benefits include:
Source: Azure

What does this mean for Power BI Users?
For existing Power BI users or for anyone who wants to explore Fabric, you'll have to keep these things in mind:
In case you're looking for a licensing guide with Fabric details, then check out our Power BI licensing guide
Most asked question about Microsoft Fabric by PBI users
"This 'X' feature on Power BI will it be available on Fabric?"
If the feature is shared across multiple Power BI artifacts, it'll most likely be there. Since Fabric and Power BI share the same SaaS workloads there would be improvements and benefits to them too.

Please note: Fabric Pricing would change according to the geographies and the Capacity units chosen

Though most of what's written above is more relevant for new Power BI users- it is also something users looking to migrate to Power BI must consider.
As Microsoft Partners, we ensure effective migration by carefully considering the following:
Some of the benefits our clients have seen due to migrating to Power BI are:
Share our short Migration guide to Power BI
What's next?
Get your hands dirty and get started with Power BI desktop. But if you're looking for someone who can guide you through this journey right from inception or if you're looking into Fabric - drop us a message and our Microsoft experts will get back to you.
Further Reading
About Author

CTO, Polestar Analytics Ex- Deloitte

Loves to write and talk about everything data