 SudhaData & BI Addict
Sign up to receive latest insights & updates in technology, AI & data analytics, data science, & innovations from Polestar Analytics.
Editor's Note: Establish Spend Analysis as the cornerstone of the strategic sourcing process and understand all that is involved in building an optimized and adaptive spend analysis practice. In this article, we explore what spend analysis is, its types, benefits, how to approach it, spend management KPIs, methods, where organizations fail, how to improve analytics maturity, best practices, and a comparison between key spend analysis technologies.
If you ask a procurement leader how they would define the change over the last few years, some of the words they’ll use would contain chaotic, disorganized, no visibility, inefficient, costly, etc. But if you ask them about their goals and priorities, they’ll most likely give the same answer they had a few years ago: cost reduction, digital transformation, and strategic sourcing. But two things that have definitely changed even in them are the pace of adoption and improvement in digital maturity.
Today let’s focus on one of the key processes that would always be the concern of CPOs, especially for cost reduction: Spend Analysis.
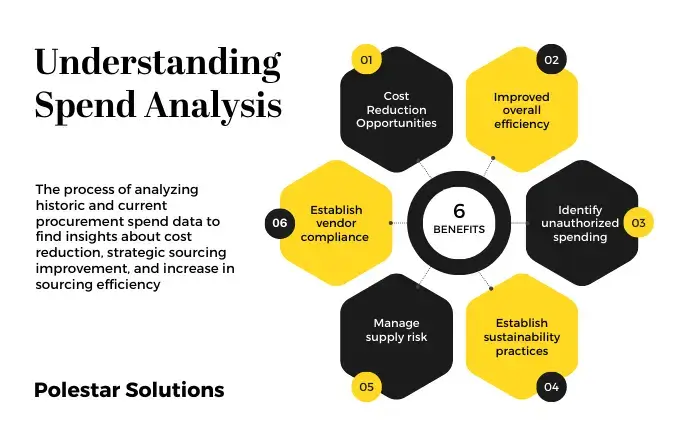
Spend Analysis is the process of analyzing historic and current procurement spending data to find insights about cost reduction, strategic sourcing improvement, and increase in sourcing efficiency. Though these three are the top reasons for spend analysis, normally it is to provide a 360o overview about the purchasing data to give an idea about questions like:
To answer these questions, you would need data regarding suppliers and payment terms of all the products, the quantities bought at what prices, what type of spend and BU is it mapped to, etc. In general, the idea is to bring in more visibility and streamline workflows.
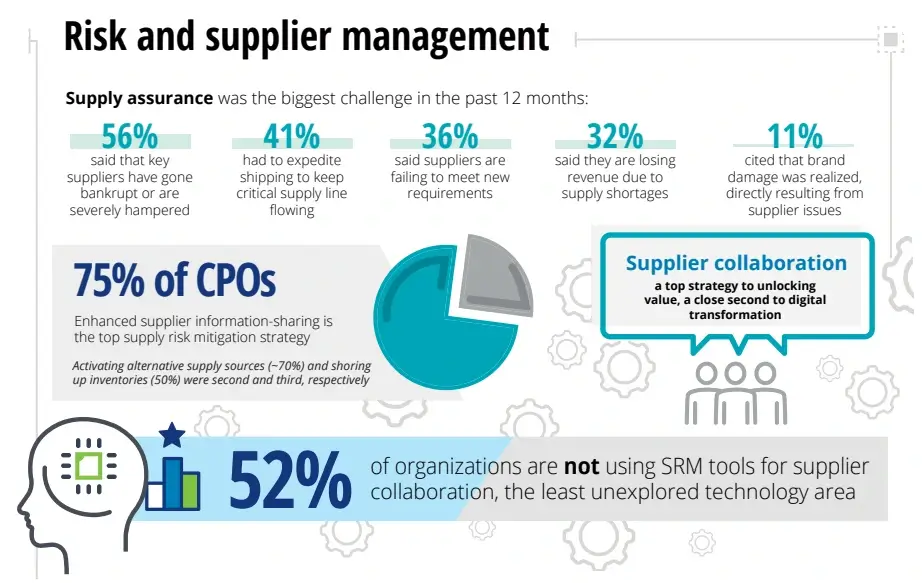
Most of the importance lies in what it is being used for. Look at the report by EY below:
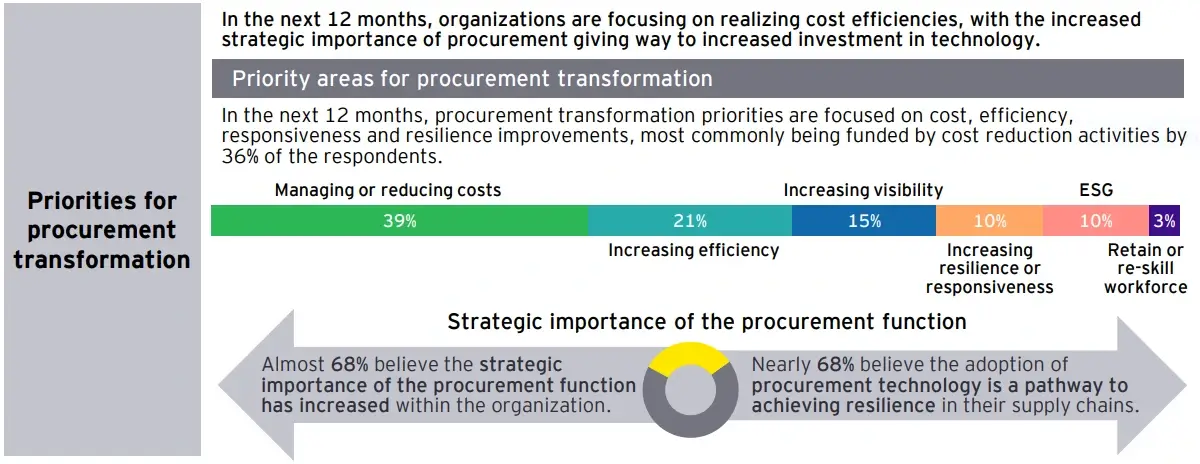
Source: EY 2022 Global Procurement Survey
Here’s a gist - The top priorities of procurement leaders are:
Consider the top 3 priorities i.e. what 75% of procurement leaders want and visit the definition of Spend analysis again: analyzing data to find insights about cost reduction, strategic sourcing improvement, and increase in sourcing efficiency.
The procurement leaders wanting it is one way to look at it, another way would be to look at the impact it would have on the organisation.
The difference between an average organization and the best-in-class organization, especially for the ones with low margins and higher costs is highly dependent on the spending patterns. The average organizations manage only 55-60% of their spending, whereas best-in-class performers manage close to 85%. Though it might look small, bringing in incremental changes of even 5-10% - can bring an overall savings of up to 1-2% for the organization.
Most of you must have heard about Porter’s 5 Forces - Competitive Rivalry, Supplier Power, Buyer Power, Threat of Substitution, and Threat of New Entry. Two of them are very relevant for organizations from a procurement POV: the bargaining power of suppliers and the bargaining power of buyers. It is only by analyzing the existing spending that one can find if there is more power to leverage or if you are subject to the power of other suppliers.
These can be considered indirect benefits like others including bringing more visibility, improving compliance, establishing a sustainability profile, understanding vendor value, etc. But if we are to see what some key direct benefits that can be achieved by analyzing the spending data, they would be:
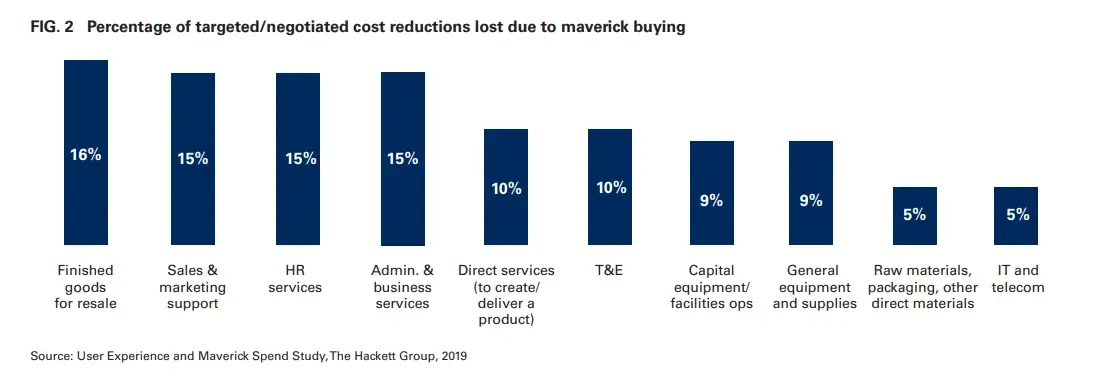
Minimized Maverick Spending: Intentional or not, maverick spending can cause cash leaks due to excess or unplanned spending, loss of negotiated savings, and sometimes even reputational loss. A report by the Hackett Group estimates that as much as 16% of negotiated savings are lost when this occurs.
Working Capital freed: By identifying the right vendors and suppliers, organizations can reduce not only the order-to-pay cycle times but can also reduce the overall PO costs thereby increasing the cash flow and freeing working capital which can be leveraged as a profit center.
Identify spend patterns: This provides a view into the spending patterns and buying trends across the enterprise mapped to costs. As such this can help view the overall indirect & direct costs and the percentage of costs that go into excess or unwanted spending. This provides more scope for supplier consolidation, improving efficiency, and creating reports for realized savings.
Decrease in Procurement Costs: Given that the external suppliers' cost for a procurement-based organization is commonly around 40-80% of the total cost, finding any contract leakages or additional spending can bring in more savings. With effective procurement planning, you can have reduced manual labor, greater efficiency, fewer errors, and more timely data for analysis.
Improved Risk & Supplier Management: By improving contract compliance you can limit supplier risk and reduce scope for invoice fraud. For example, do you have vendors that have had compliance issues repeatedly or associated costs due to any delays/ complaints? Do you have any specific spend type like travel and expense that is going beyond plan, would it benefit to have an intervention from the finance department? Answers to such questions can be easily identified and answered to reduce risk beforehand and manage suppliers easily.
Now that we’ve understood the why and the what behind spend analysis, let’s get started with the where- “Where to start?”. Like any other analysis, you need to start with the data. Normally, spend analysis data sources would be related to finance, especially purchase orders.
But for further analysis of suppliers or for complete visibility one might need data from:
You might not need all the data sources. Depending on the software or processes that the organizations use or what they already have some or all of them can be used. With the increased automation in the entire process, a smaller number of errors can be seen, therefore more processes with ERP data or EPM data would be more seamless.
Enable seamless data integration for all your data analysis needs
Though we’ve spoken about the types of spend analysis here and there till now, we’ve just scratched the surface. Now let’s get into the details. The types generally depend upon the specific objective and the focus on what the analysis is about.
Some of the major types of spend analysis include:
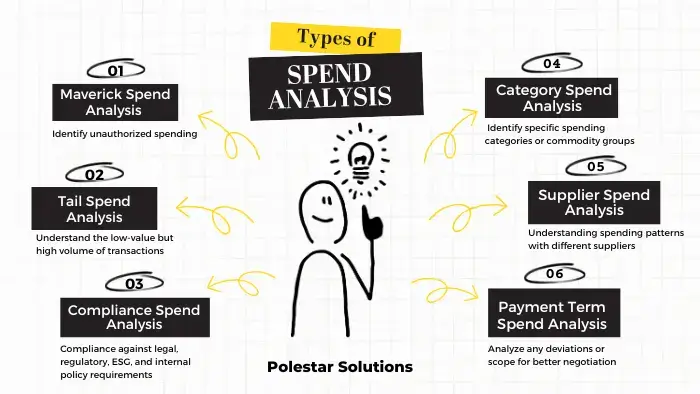
When unattended, maverick spend can have a hefty dent in the savings and the margins of both the company and the procurement costs. By analyzing the scale and frequency of such spending, procurement leaders can drive insights into what kind of additional items are being procured outside the contract and either find an existing or new supplier with better terms of negotiation.
These are the transactions that are typically associated with low-value but high volume. For example, they might constitute ~ 20% of the entire spend cost but would roughly amount to 80% of the transactions. These transactions are usually non-strategic in nature, but by analyzing the amount of suppliers, the transactional values, etc., companies can identify if there is a scope for supplier fragmentation or consolidation.
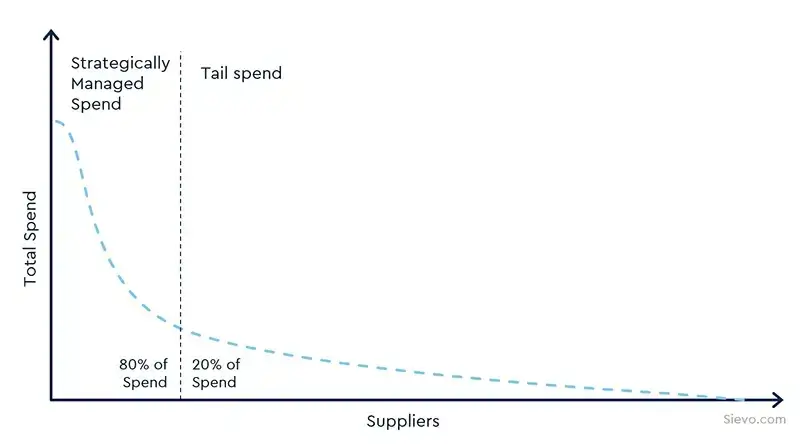
Source: Sievo
Identify areas of non-compliance spending against legal, regulatory, internal, environmental, social, and governance policies. It can help with the evaluation of suppliers for their compliance effectiveness and the percentage of compliance adherence of the organization too. Given that there is an increase in sustainability concerns from both producers and consumers, this might be very crucial for certain organizations.
By defining taxonomies or hierarchies like categories can help with identifying the number of vendors being leveraged for similar items thereby, reducing them and identifying any spend leakages if any. By mapping every spend to categories and sub-categories, procurement leaders can understand the scope and breadth of spending needs. This will help with identifying needs and forecasting better saving opportunities.
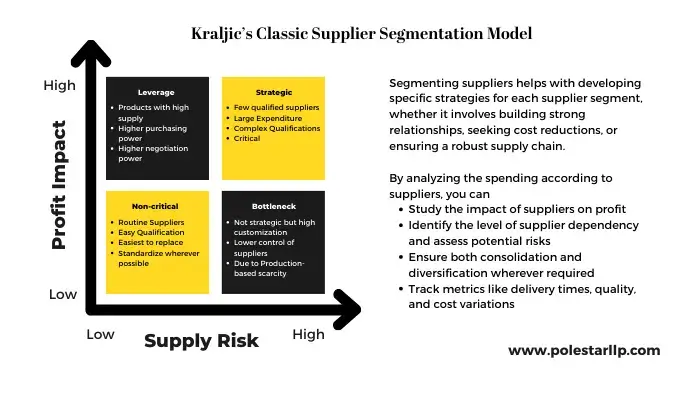
By analysing what spend is coming under multiple types of suppliers. One type can be to analyze the strategic, bottleneck, leverage, and non-critical suppliers. With this organizations can understand if they are getting best value with the associated risks. Other types can include analyzing risk based on top (example N=100) suppliers based on value, volume, geography, and need.
It helps organizations identify opportunities for optimizing payment terms, such as negotiating better discounts or extending payment cycles. This might be especially useful at the time of re-negotiating contracts where you can get optimized payment plans or extended payment cycles.
These are just the most used and common types of bifurcation done for analysis, but depending on the need of the organization, available data, and areas of focus you can include other types based on Item Spend, Vendor, Contract, Compliance, Savings Opportunity, Demand Consolidation, Strategic sourcing, etc.
What we’ve spoken till now is a mix of some theory and practical examples, but now let’s dive a little into the details about the implementation and how to measure the impact for various benefits.
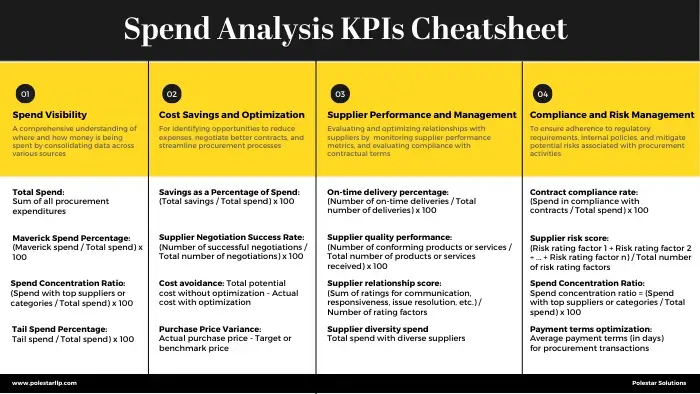
For starters instead of bombarding you with a lot of key performance indicators let’s bucket them into 4 major groups:
Some key KPIs under each of them can be seen in the image below:
Though we’ve spoken about a few KPIs above, practically there would be a need to slice and dice the data as per parameters. Imagine the data like a cube with category, supplier, and cost data. By then slicing the data you can get parameters like:
We have listed down multiple ways in which you can analyze the data. You can build your KPIs as per the data you have available and the best way it would be useful for cost reduction and efficiency improvement.
Pro-tip: If you are confused about how and where to start, go back to your data and start with creating categories and defining the right taxonomy. Only by understanding and creating categories that are Mutually Exclusive and Collectively Exhaustive (MECE) can you find the right insights. Then the KPIs can established as per your needs.
Given that 47% of the companies aim to achieve cost reduction through digitalization, and 77% are on board with the idea that S2P digitalization is a must, the idea of analysis is not a new idea nor a new thought for procurement leaders. So, it either must be that they don’t have the capability to get it implemented or that they have tried and tested it but it has not come to fruition.
Let’s explore the top 5 reasons why such projects fail. It is to be noted that though these reasons here are for why spend analysis projects fail, they might be applicable in general to any analysis implementation failure.
1. Data Quality and Accuracy
Though it might sound basic, take Pivot tables, even the slight negligence while filling in data would cause errors across various sheets – extrapolate that to data from multiple data sources, data systems, and user inputs, and you might be left out with data that is either unworkable or with a lot of errors. Here’s an example:
A sample spending record with the finance can be like this:
| Vendor Name | Item Description | SECT Code | Code Description | Spend Amount |
|---|---|---|---|---|
| SSK Suppliers | SE 14151 Machinery Items | E02003 | Screws and Nuts | $43506 |
The same sample data can be recorded in the PO as:
| Vendor Name | Item Description | SECT Code | Code Description | Spend Amount |
|---|---|---|---|---|
| SSK Suppliers Pvt Ltd | Machinery Items | PO 12022002020202 | Screws and Nuts | $43506.56 |
The two different tables talk about the same data but there are changes in the vendor name, category, spend amount, and item description. And this is just with the data accuracy. Some other data quality issues can be with
2. Unrealistic expectations
Data Analysis is not a sprint, it is a marathon. Most people try to focus on what every team wants superficially and thereby undermining the overall practice. These unrealistic expectations can result in disappointment, loss of confidence, and even a lack of commitment to data-driven insights.
Instead of looking for immediate cost savings or process improvements, you need to focus on what the key focus areas are first or start with one function and implement one ad-hoc project to see how it is going. Starting small then scaling it to the functions or areas you want to have analysis is the best way to approach an analysis implementation. You’ll have to think of it as placing a series of gears in place that can create more momentum.
3. Making it a one-time effort
Even unsupervised machine learning needs time to learn from the training data set to give inputs- why shouldn’t a process be developing continuously? By focusing all the efforts for one-time implementation, you not only lose valuable insights but also the time, effort, and resources used would be gone to waste.
Continuous monitoring, analysis, and improvement are necessary to identify changing spending patterns, supplier relationships, and cost-saving opportunities over time. Neglecting the need for sustained efforts can lead to missed opportunities and stagnant procurement practices. This would also eliminate the scope to grow analytics maturity of the processes.
4. Low technical expertise
As a procurement leader, would you knowingly order from a supplier who provides goods at a subsidized quality? Then why should you have a not-so-expert approach for analytics?
For an all-around implementation, users need to have a combination of analytical expertise, procurement knowledge, and technological understanding of tools and software used in analytics which most in-house teams don’t possess. Such an implementation without the right knowledge can lead to lower adoption rates, ineffective interpretation, lack of scalability, and higher costs of infrastructure.
Without the right knowledge about data processing and data integration capabilities, organizations might not capture all the right data sources or have difficulties integrating them into a data warehouse or data lake for analysis. And this is just the beginning, with complex calculations, you might need advanced analytics capabilities that might need data science and mathematical understanding.
5. Lack of executive buy-in and low adoption
Lack of support from top-level management can result in limited resources, inadequate funding, and a lack of prioritization. Additionally, if employees and stakeholders do not embrace the importance of spend analysis or fail to utilize the insights generated, the project's impact and sustainability can be compromised – making change management one of the primary concerns for any implementation.
Before procurement leaders approach spend analysis or any other analytics project they must carefully consider planning the adoption and training with the end users such that they are aware of how to adapt to the new process and how to shift some of their existing workflows/processes into the new tech stack.
Manage your contracts, invoices, suppliers, categories, and orders in addition to spend.
From objective identification to analysis, a normal spend analysis steps involve the following 6 steps:
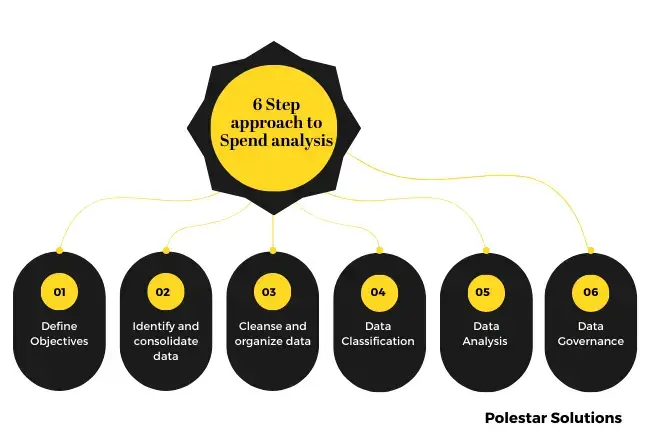
1. Define Objectives
Though this sounds like something everyone would say, it is the most important part of the entire process as this determines both the end goal and the layout for the approach. By defining objectives we mean determining the scope, identifying key focus areas (e.g., categories, suppliers), and establishing the desired outcomes of the analysis like understanding the key KPIs that you want to target.
2. Identify and consolidate data
We’ve already spoken about the multiple data sources that are collected for recording spend data – like procurement PO data, financial data, etc., so we won’t go into it again. The goal of identifying and consolidating data is to gather a comprehensive dataset for analysis. So, if there is an overwhelming amount of data, you need to define what exact data sources need to be integrated first based on the objectives and goals.
3. Cleanse and organize data
Garbage In = Garbage out is the principle of data management. Only when you have clean data can you possibly have actionable insights from your data. Also, the time spent on data cleansing would depend on how the data is spread across multiple systems or sources, the different data formats and varying levels of detail, it can be more time-consuming to consolidate and cleanse. Given that most companies still rely one excel or spreadsheets for their data, there would be a lot of miscellaneous data in multiple formats needing more time for data management.
4. Data Classification
This involves categorizing spend data based on different criteria such as suppliers, products, services, departments, or geographical locations. This for example also involves classifying each of the suppliers based on their profit vs value (check out supplier segmentation model in the types of spend analysis section), grouping them according to parent company – for better margins, and bringing all the data under single taxonomy to bring better visibility.
5. Data Analysis
Once the data is cleansed and classified, it can be analyzed to gain insights and identify trends. Various analysis techniques such as spend distribution, supplier performance analysis, cost variance analysis, and benchmarking are used to examine the data. The analysis aims to uncover opportunities for cost savings, supplier consolidation, contract compliance, and other strategic insights. We’ve already spoken a lot about this won’t go into details again.
6. Data Governance
The final step of spend analysis involves establishing data governance practices to ensure the ongoing accuracy, integrity, and usability of the data. This includes setting up processes for data validation, documentation, and maintenance. This ensures that the results of the analysis are reliable and can be used for informed decision-making not just for the short term but also for the long run. Since the process of data governance involves regular checks and feedback you can also constantly keep track of which KPIs are working and which need to be re-strategized.
This process and steps would normally be applicable for companies who are looking to start their analytics practices or are looking at what can be done in their practice. But you might ask us what about the companies who already have some level of analytics practice but want to improve their maturity? Then this is for you.
This answer would depend on what your current data collection, transformation, data analysis, advanced analytics, and governance capabilities are. The better and advanced capabilities you have the better maturity you would have. To help you understand this better we’ve devised an analytics maturity framework.
Please note: Though we’ve represented this in a linear fashion, it can be with a lot of granularities depending on the approach, adoption, and adversities.
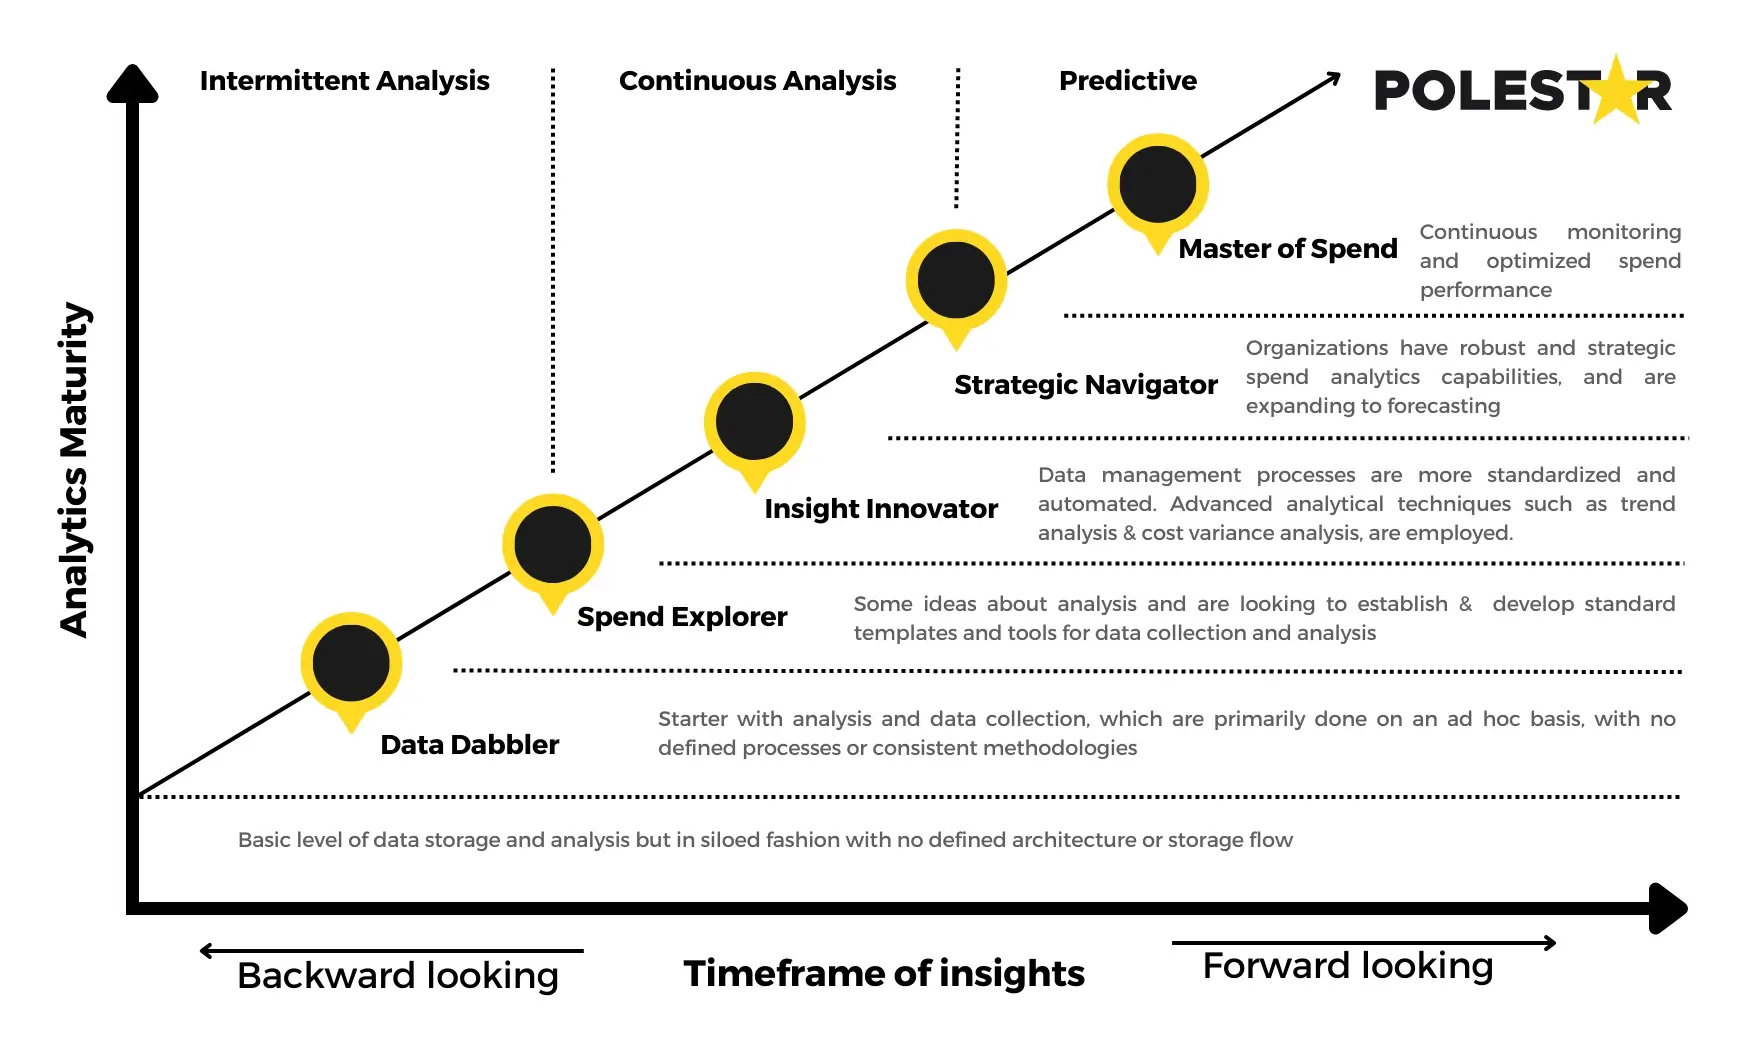
1. Data Dabbler
These organizations have limited or ad-hoc analytics capabilities. Both data collection and analysis are done on an adhoc basis. This is the kind of analysis done by Category managers and sourcing specialists when they need to analyze spend on a small scale, when needed, to source a category, etc.
a. How does the data look like: Data is often incomplete, inconsistent, and fragmented, leading to limited visibility and insights into spending patterns.
b. Strategy to get here: Conduct basic spend analysis using simple reporting and filtering techniques. Focus on understanding spending by suppliers, categories, and departments.
2. Spend Explorer
Procurement functions that fall under this category, would normally start developing standard templates and tools for collection and analysis. The focus would be mainly on most needed analysis data like transactional data or spend categories.
a. How does the data look like: Data is partially consolidated and standardized, but some inconsistencies may still exist. Basic analysis reports are generated providing insights about categories or supplier performance.
b. Strategy to get here: Spend data is classified into meaningful categories and subcategories. Classification methodologies are implemented to ensure consistency in spend analysis.
3. Insight Innovator
The organization gains better insights into spending patterns, identifies opportunities for cost savings and supplier optimization, and establishes some benchmarking practices; by employing Advanced analytical techniques, such as data segmentation, trend analysis, and cost variance analysis.
a. How does the data look like: Data is well-consolidated and standardized, allowing for more accurate analysis. Advanced analytics techniques are started being leveraged to provide more details into spending patterns.
b. Strategy to get here: Establish automated data feeds for seamless and real-time data updates. Utilize tools and algorithms for identifying cost-saving opportunities and supplier performance insights.
4. Strategic Navigator
Organizations that are strategic navigator level, have robust and strategic spend analytics capabilities. They have well-defined and integrated data collection processes, including the ability to capture data from multiple sources and systems.
a. How does the data look like: Data is comprehensive, integrated, and available in real-time for analysis.
b. Strategy to get here: Utilize predictive modelling and forecasting techniques to anticipate future spending trends. And by fostering collaboration between procurement, finance, and business units to align spend analysis with strategic goals.
5. Master of Spend
These are the best-in-class organizations that have highly mature and optimized spend analytics capabilities. They have fully automated and integrated spend analytics processes, leveraging advanced technologies such as artificial intelligence (AI) and machine learning (ML).
a. How does the data look like: Structured data governance practices in place to ensure data quality, accuracy, and integrity.
b. Strategy to get here: Establish a culture of continuous improvement in spend analysis best practices. Regularly review and refine data collection, analysis methodologies, and reporting capabilities.
Why stop at spend analysis assess your entire supply chain to find areas of gap.
Most of the spend analysis best practices would be a mix of the processes, strategies, and spend analysis techniques that we might have spoken about above. But for the sake of summarizing and emphasizing, let’s take a peek at what the spend analysis best practices should be:
Have a MECE data classification such that would get a precise view of spending as per suppliers and categories. Having a good data foundation can only result in good data analysis.
Create automated ETL, data cleansing, and classification layers. Establish your data warehousing and data lake process efficiently such that your data pipeline is error free, manual reconciliation proof, and real-time.
Data sources should be leveraged. Connect all the data possible from your vendors, suppliers, affiliates, etc., this can help you create a comprehensive view of spending.
Grow your analytics maturity. Once you are past the Spend explorer phase, you need to start leveraging advanced analytics capabilities like data segmentation, trend analysis, cost variance analysis, benchmarking, predictive modelling, and machine learning algorithms. These will create more opportunities for optimization
Evaluate continuously. Keep a track of the changing metrics, industry trends, regulatory compliances, and changes in the market. Regular reviews and checks can help identify areas of review and feedback immediately. Don’t wait for an initiative or KPI to be no longer relevant to re-evaluate.
Collaboration is key. Though the key stakeholders of spend analysis would be procurement and finance teams to achieve the maximum potential savings, collaboration between business units and procurement needs to exist. By clearly communicating the implications and integrating the perspectives of multiple stakeholders even before the contract cycle can enhance the effectiveness and relevance of your practice.
Pro Tip: Added advantage for the CFO
The benefits that spend analytics provides for CFOs are three-fold. In the short-term: In addition to cost reductions, spend analysis can improve cycle times, process efficiency, and staff productivity. In the long-term, the automation and centralization of data management can result in better demand management and business planning, sales performance, and supply chain optimization. The third benefit is that in the case of an M&A, where the goal is reduction of cost of ownership having a clear visibility can help reduce risk and manage compliance.
There are many tools in the market that are widely used for spend analysis, the most common one starting from excel. Depending on the complexity of the analysis you can even use advanced analytics tools like R, Python, etc., most common tools for visualizing the KPIs and the analysis would be Power BI, Qlik Sense, and Tableau.
Here is a small comparison with the three of them and excel.
| Feature | Excel | Power BI | Tableau | Qlik Sense |
| Data Import | Supports various file formats | Supports multiple data sources | Supports various data sources | Supports multiple data sources |
| Data Cleansing | Basic capabilities | Limited data cleansing features | Limited data cleansing features | Advanced data cleansing features |
| Data Visualization | Limited chart options | Rich visualization capabilities | Rich visualization features | Rich visualization capabilities |
| Advanced Analytics | Limited capabilities | Limited built-in analytics features | Advanced analytics features | Advanced analytics capabilities |
| Interactive Dashboards | Interactive Dashboards | Interactive and customizable dashboards | Interactive and dynamic dashboards | Interactive and customizable dashboards |
| Collaboration | Limited collaboration features | Collaboration and sharing capabilities | Collaboration features | Collaboration and sharing capabilities |
| Scalability | Limited scalability | Scalable for large datasets | Scalable for large datasets | Scalable for large datasets |
| User-Friendliness | Familiar interface | User-friendly and intuitive design | User-friendly and intuitive design | User-friendly and intuitive design |
| Integration | Limited integration options | Integrates well with other Microsoft tools | Integrates with various systems and tools | Integrates with various systems and tools |
This table shows that while analyzing spend data on Excel is possible, a lot of issues regarding data inconsistencies can be seen. For example, data formatting issues like having the same supplier different names or regional settings causing inconsistency will result in a lot more time wasted on data cleansing than actual analysis. Therefore, in comparison data visualization tools would fare better. All three of them are the most commonly used BI tools in the market, and only a further detailed check into the current data architecture, can a choice be decided.
Here are the definitions of few key topics around spend data analysis that you might need a refresher with or just for a final check:
Spend Management: The strategic and operational activities undertaken by an organization to control, optimize, and track its expenditures across various categories and suppliers. Spend Analysis can be considered a part of spend management.
Contract Leakages: Instances where there is non-compliance or deviations from agreed-upon contract terms, resulting in financial losses or missed savings opportunities for the organization.
Maverick Spending: Unauthorized or uncontrolled purchases made outside of established procurement processes, often leading to higher costs, lack of visibility, and increased risk for the organization.
Spend Data Management: The systematic approach to collect, cleanse, organize, and maintain accurate and reliable spending data to support effective spend analysis, decision-making, and overall procurement operations.
Data Cleansing: The process of identifying and correcting errors, inconsistencies, and inaccuracies in spending data to ensure its accuracy and reliability.
Data Categorization: The practice of organizing spending data into meaningful categories and subcategories based on common attributes or characteristics.
Data Classification: The process of assigning labels or tags to spending data to group similar items together based on predefined criteria, such as suppliers, expense types, or departments.
Cost Variance Analysis: The comparison of actual costs incurred with budgeted or expected costs to identify discrepancies and understand the reasons behind cost variations.
Supplier Performance Analysis: The evaluation and assessment of supplier performance based on various criteria, such as quality, delivery, pricing, and compliance, to optimize supplier relationships and enhance procurement strategies.
If you’ve made it till here. Bravo! You have a good understanding of what spending analysis is about! But if you are still concerned about any of the issues that might arise during the implementation or if you are looking to improve your analytics maturity or if you just want to analyze where you stand now, we can help you.
Our Procurement Expertise combined with our technological experience can be the right partner you are looking for. Talk to our experts today!
About Author

Data & BI Addict
When you theorize before data - Insensibly one begins to twist facts to suit theories, instead of theories to suit facts.
Related Blog
 Debadutta
Sudha
Debadutta
Sudha