 SudhaData & BI Addict
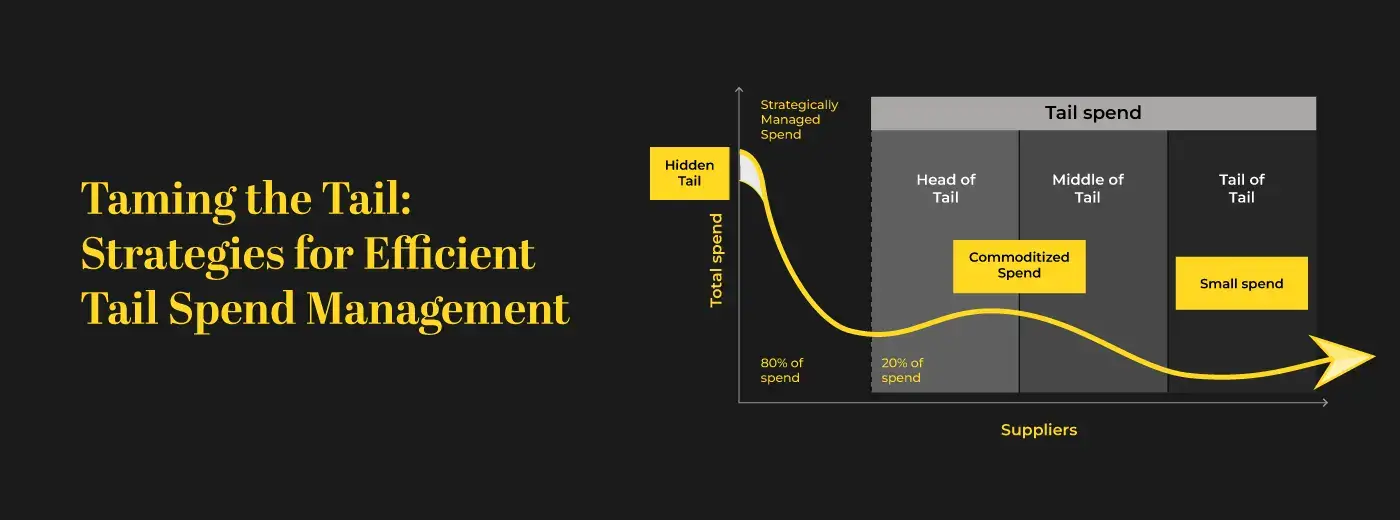
Sign up to receive latest insights & updates in technology, AI & data analytics, data science, & innovations from Polestar Analytics.
Editor’s Note: Understand the impact of tail spend i.e. high volume small purchases can have on your business. We highlighted the key tail spend issues, challenges, benefits, and how to start with tail spend management analysis for cost savings, supplier consolidation, and process efficiency.
Have you looked at your credit card or bank statements at the end of the month and felt like: Where did all the money go? Then you know the feeling of how these little things can accumulate and create an unwanted burden on your bank balance. Today we’ll address how these small procurement spends i.e. tail spend affect a business. Let’s discuss how it happens, why it is relevant, and where to start managing it.
Please Note: All the procurement tail spend can’t be treated as bad or unnecessary – it needs to be analyzed and understood whether it has a problem and how it needs to be optimized.
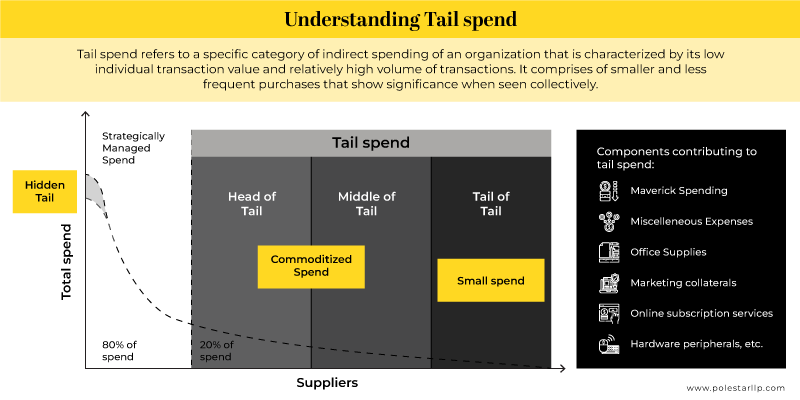
Everyone knows what tail spending is: The low value, high volume spending normally referred to as the C- Spend that has a wide array of suppliers with low risk. This is attributed to around 10-20% of the total spending of an organization.
Though there are many ways to explain it one of the most commonly used ones is the Pareto principle – 20% of spend for 80% of the items (it can vary from 70% to 90% of volume & 10% to 30% of value according to the organizational spend). Other is based on the definition of each organization based on a number they define (be it 10k or 100k) as per their spend data.
We’ll not delve into the definition further but let’s take a dive into what it comprises:
Some examples of tail spend in procurement include Office supplies, maintenance and repair materials, travel expenses, courier and shipping costs, subscription costs, training and education fees, etc. Though some of these are planned, a lot of companies fail to categorize them or map them due to their volume being low.
Though regarded as the weak link of procurement spend it is important to remember that all tail spend “is not bad”. In most organizations, some level of tail spends like petty cash purchases or low-level spend is normal and is a part of the general operations of the company. But the problem lies in its visibility and its mapping.
To understand why mapping tail spend is important, you need to also understand the benefits it provides. Here’s a three-fold benefit:
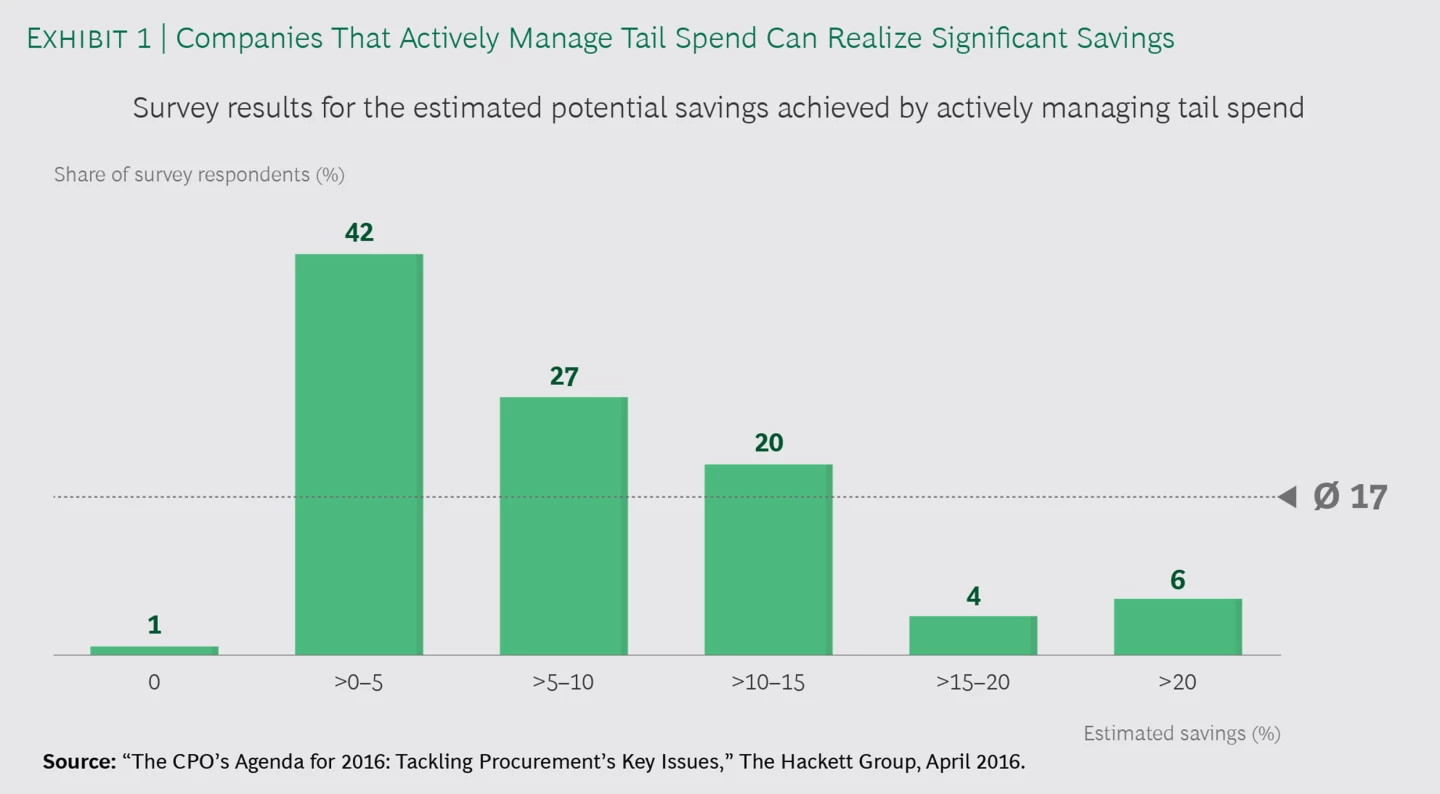
Cost Savings: Reducing spend costs has always ranked among the top three priorities of procurement leaders atleast for the past few years. According to a Hackett group survey, procurement organizations in the top quartile in both business value and operational excellence enjoy a 90% advantage compared to peers on cost spends. Given that tail spend accounts to upto 20% of the total spend costs, even a savings of 5-10% would impact the bottom line.
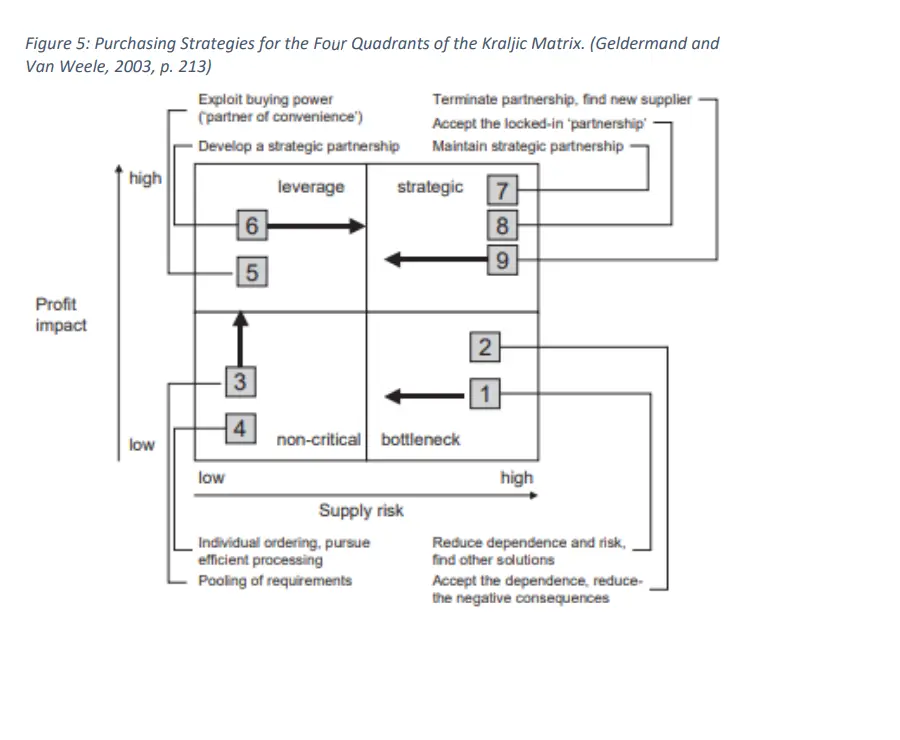
Supplier consolidation: Since most of the suppliers under tail spend would be low risk, most organizations try to view them as non-critical. Referring to Kraljic’s supplier segmentation model, they would normally fall under either non-critical or bottleneck suppliers. The best way to improve their efficiencies is to pool requirements, build custom tailor-made solutions, and/or find consolidated suppliers to achieve economies of scale & improve negotiating power. You can provide feasibility to pursue individual orders when needed but with efficient processing, and reduce dependence on bottleneck suppliers.
Process Efficiency: Spend leakages occur when you deal with non-approved, non-preferred, or non-contracted Suppliers. When dealing with tail spend, because they normally don’t go through a streamlined process and are on a use-case basis business, dealing with such suppliers increases friction and inefficient spending.
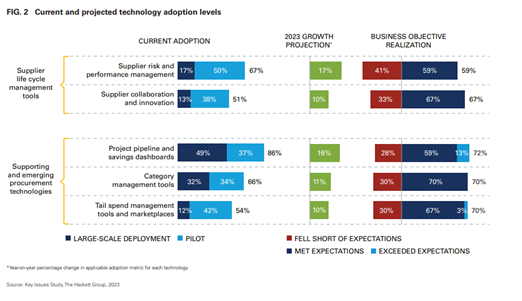
To avoid this businesses can include pre-approved suppliers, approve e-marketplaces, or create catalogues for their tail spend. According to 2023 research by Hackett Group, more than 70% of leaders felt that tail spend management tools have either exceeded or met their expectations.
Some other benefits include reduced cycle times, the ability to drive spend to more sustainable or approved vendors, creating less exposed risk, etc.
Identify the right KPIs with our procurement periodic table and define the maturity of your procurement practice.
Kickstart your procurement analyticsBut how do we know your procurement tail spend has a problem? If you are thinking this – then revisit how you approach tail spend. Most organizations feel like the process implementation is too costly. But for them,, it is actually costlier to not analyze tail spend for their business. The potential savings are often overlooked due to a low expectation of return, lack of visibility and internal resources, and benchmark data.
You might have a problem when you keep hearing things like: “Why are we paying Supplier B extra price for the same product as Supplier A”, “These are not our normal terms and conditions”, “There is no central supplier database”, “These transactions don’t reflect in our ERP”, etc.
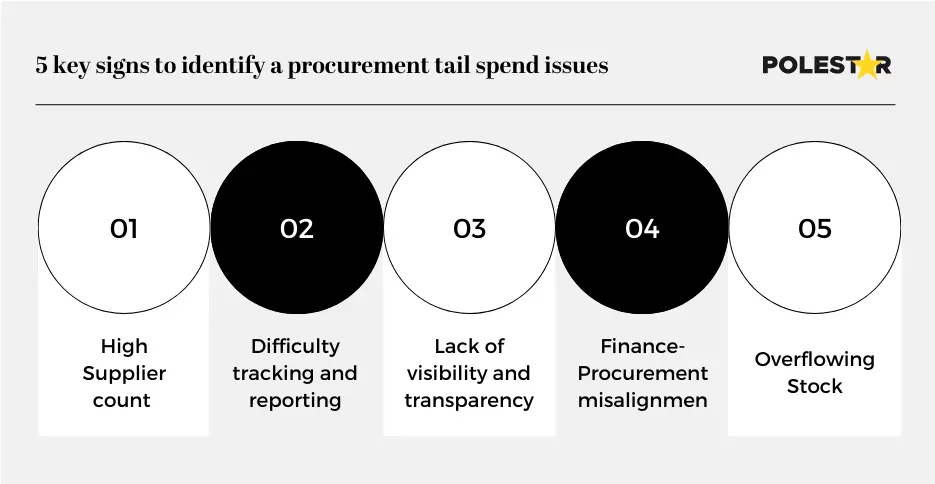
High Supplier count: A fragmented supplier base can result in reduced leverage during negotiations for volume price dealings, increased administrative burden, and missed opportunities for cost savings.
Difficulty tracking and reporting: Difficulty in categorizing, classifying, or consolidating the data makes it harder to monitor spending patterns, identify cost-saving opportunities, and make informed decisions.
Lack of visibility and transparency: Without clear visibility into the categories or data, it becomes challenging to effectively manage and optimize purchases. This can be a result of overreliance on manual processes like emails and spreadsheets without having a common database.
Finance-Procurement misalignment: When finance and procurement teams “define” their low-value spends differently, or because the understanding around tail-end spending is not as deep as it is needed to be in your organization. This can result in a miscalculation in procurement invoices by either one of the teams.
Overflowing Stock: This means the procurement problem has overflown into inventory management. This arises when multiple departments or functions manage their inventory replenishment independently leading to higher storage and holding costs.
If you feel like you are experiencing any of these, then you should try a procurement or tail spend audit to help with the reduction.
Before we jump into What is Tail spend analysis, Mapping and the process of tail spend implementation, it is important to have a small note about the reasons why tail spend is difficult to manage.
Some of them include:
Though we’re not going to address them today, it is to give an idea about where the problem lies. Once you have executive buy-in for proper tail spend analytics, you need to start where most procurement leaders have issues with i.e. lack of expertise or visibility.
Here is a 5-step approach to follow for your tail spend optimization:
Step 0: Defining a taxonomy
This is defined as step 0 and not step 1 because without effective taxonomy i.e. grouping data into different classes with the help of codes or numbers, none of the other steps would be even possible. If you have no codes defined, start there, you’ll have to allot codes to the goods and the suppliers for easy analysis.
Step 1: Classify your tail spend data
Tail spend data is highly distributed and is very broad as the items and margins can be varied based on their position.
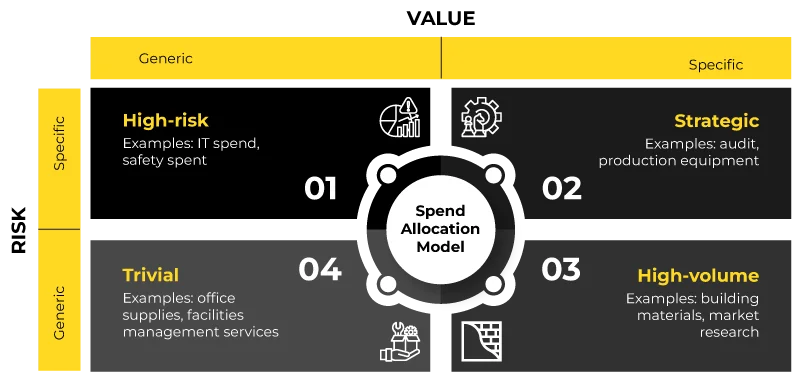
The first level of segmentation has to be done whether the items are strategic in nature or would come under tail spend. Once this level of segmentation is done, the tail itself can be bifurcated into 4 different parts.
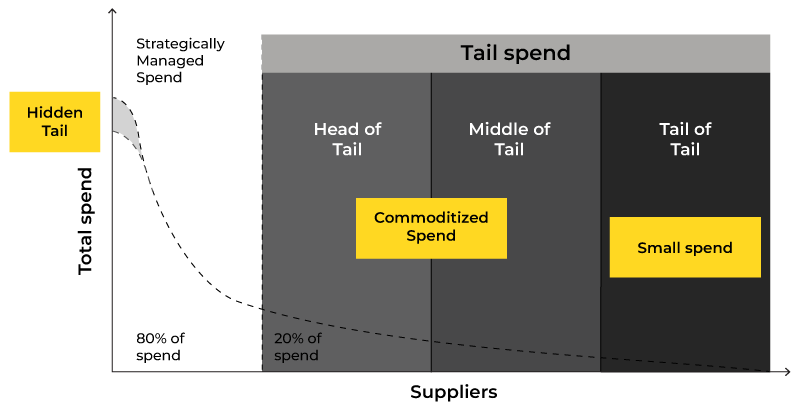
This level of classification can bring visibility into both the areas where the fragmentation and price variation is maximum.
Step 2: Segmentation of suppliers
You need to understand the supply market, to understand your purchasing power across multiple categories and geographies. Normally in an organization supplier segmentation is done with ABC analysis, with “A” category suppliers getting the management attention. There are multiple ways to do this, we’ll discuss the top 3 for today.
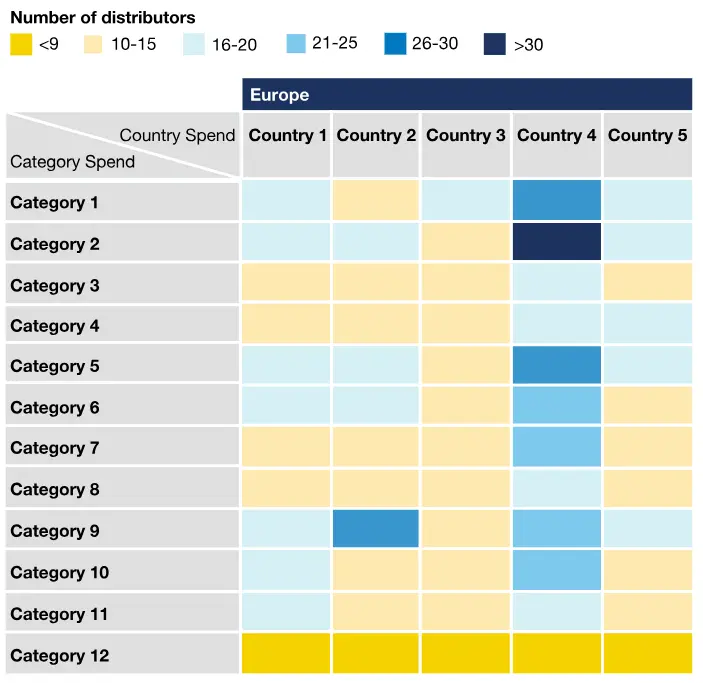
The first way is to understand the suppliers based on a heat map. You can simply map the types of category and the number of suppliers per geography as per your needs.
Second way: Supplier Clustering. This can help you not only understand the number of suppliers but bundle and cluster them according to similar purchases. Some of the common machine learning algorithms that can be useful can be k-means clustering, hierarchical clustering, mean-shift clustering, gaussian mixture model, spectral clustering, etc.
Boost your supplier collaboration with Polestar Analytics maturity assessment.
Get Supplier Collaboration datasheetThird way: Spend allocation model. With this model you can map the suppliers based on their risk and their value (similar to Kraljic’s model). This can help assess the roadmap and strategy creation for immediate vs long-term plans.
These three types of supplier segmentation can be used not only for tail spend but for any supplier segmentation. It is especially important for tail spend as the mapping and further can create unrealized cost savings.
Step 3: Establish strategy & baseline metrics
The strategy for mapping tail spend has to come from management itself. First understand the hierarchies at which tail spend is being mapped. For example, here’s a sample level of hierarchies:
Level 1: Firm Strategy
Level 2: Functional Strategy
Level 3: Category Strategy
Level 4: Head/Tail Spend
(Next levels can be developed specific to organizations)
Level 5: Purchasing solutions
Level 6: Solutions used
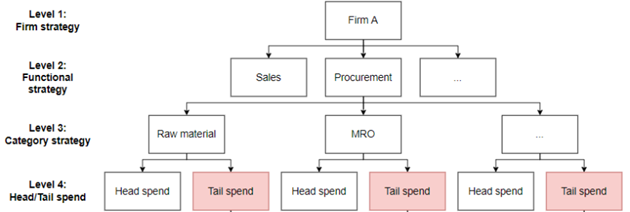
The strategy or the type of hierarchies need to be defined based on how the purchasing strategies are created, sourcing levers, execution level, etc. By bifurcating head and tail spend at a strategic level, an approach with clear visibility can be implemented.
Step 4: Identify critical use cases
Once a strategy is set in place, you need to define the KPIs for tail spend analysis and also find the most important and critical use case for implementation. You can’t scale the approach to the entire organization at once, you need to apply it to a few use cases based on function or problem. In case of doubt, the established KPIs can be referred to identify the most profitable or urgent use case.
The KPIs that are most commonly used in tail spend analysis are:
Regularly monitoring and analyzing these KPIs can help organizations identify areas for improvement, optimize procurement processes, and achieve cost savings.
You can take a look at our previous blog for more procurement analytics use cases.
Step 5: Scale and Monitor
What we’ve discussed till now mostly comes under the strategy or start of implementation. What comes after this can make or break the adoption rates of your tail spend analytics. For implementing and scaling up you need to identify the right set of tools, provide reports that are customizable, and provide considerable insights.
Once the test pilot is done on the use-case you’ll need to scale the operations to all the required functions and then keep monitoring both the KPIs and the processes.
Managing spend, let alone tail spend, is a daunting task. To get the maximum possible savings or results, you should create a team that is capable enough to handle both the technical and functional aspects of procurement, leveraging tail spend technology for better efficiency.
This is where we can help. Explore our procurement analytics services or just drop us a message and we’ll get back to you soon!
About Author

Data & BI Addict
When you theorize before data - Insensibly one begins to twist facts to suit theories, instead of theories to suit facts.
Related Blog
.png) Aishwarya Saran
Aishwarya Saran
 Aishwarya Saran