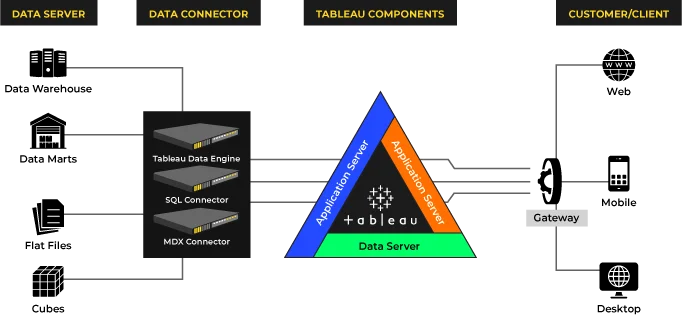
Tableau consulting services
Become smart and advanced with world class visualizations!
In this age of information overload, going back to simple and clear ways to represent data makes it powerful and useful
90% of information received is visual in nature. Creating easy and relatable dashboards can convey information quickly and effectively
Interact, create, and collaborate in the device of choice. Embed analytics in apps or applications in your analytics as required

Bring in the expertise of best-in-class data visualization experts for end-to-end tableau implementation. Create adoption strategy, plan, and execute deployment with constant support.
Discover trends and patterns, visualize KPIs, bring charts, graphs, and maps, and create graphical representation of your data with ease. Develop insights based on your data.
Eliminate the issues with improper implementation and sub-optimal user adoption. Increase ROI of your analytics investment with our training and adoption programs.
With our support, modification, development, and enhancement services we bring the expert help needed with tableau implementation.

With our 5-step approach to discover insights, we help you create your data storyboards and create scalable dashboard that can be useful for decision making
 Requirement Gathering
 Defining Objectives
 Metrics Identification
 Dashboard Creation
 Visual Storytelling
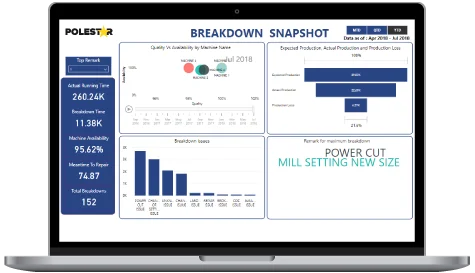
With a D-A-R Dashboard-Analytics-Reporting approach created a Tableau-based solution in place for periodic reporting and what-if analysis
Explore Case Studyeliminating manual reporting
with a single click
Accessible Reporting
