 Ali kidwaiContent Architect
Sign up to receive latest insights & updates in technology, AI & data analytics, data science, & innovations from Polestar Analytics.
Currently, Power BI has been loaded with numerous features. These features make it a perfect option for the future of enterprise analytics platforms.
Among various new features, ‘Key Influencers’ is one of the most talked visualization features powered by AI. It runs multiple statistical analyses to offer you an outcome. Here, you need to add up factors based on which the system will provide you with the right result.
This can be well explained with the help of two different examples.
Power BI services is mostly used in hotels today to keep track of the guests visiting the hotel. You can effortlessly analyze the reservation operations, red-flag issues, and reporting. It will also let you process the incredible amount of visitors data from disparate systems, turning it into actionable insight, in real-time.
Power BI analytics is also useful in shipping industries. You can easily analyze the shipping consignments that are going to be delayed. You can also use factors such as the area or the division from where the shipment is coming, and more.
So, how does it all happen?
Now since you’ve understood this Power BI, you will be intrigued to know how this happened.
The decomposition tree visual in Power BI lets you check out the various data levels to understand them better across multiple dimensions. It automatically collates data and enables drilling down into your dimensions in any order. It offers Artificial intelligence (AI) driven visualization, where you can ask and find the next dimension to drill down into, based on certain criteria. This makes it a valuable tool for ad hoc exploration and conducting root cause analysis.
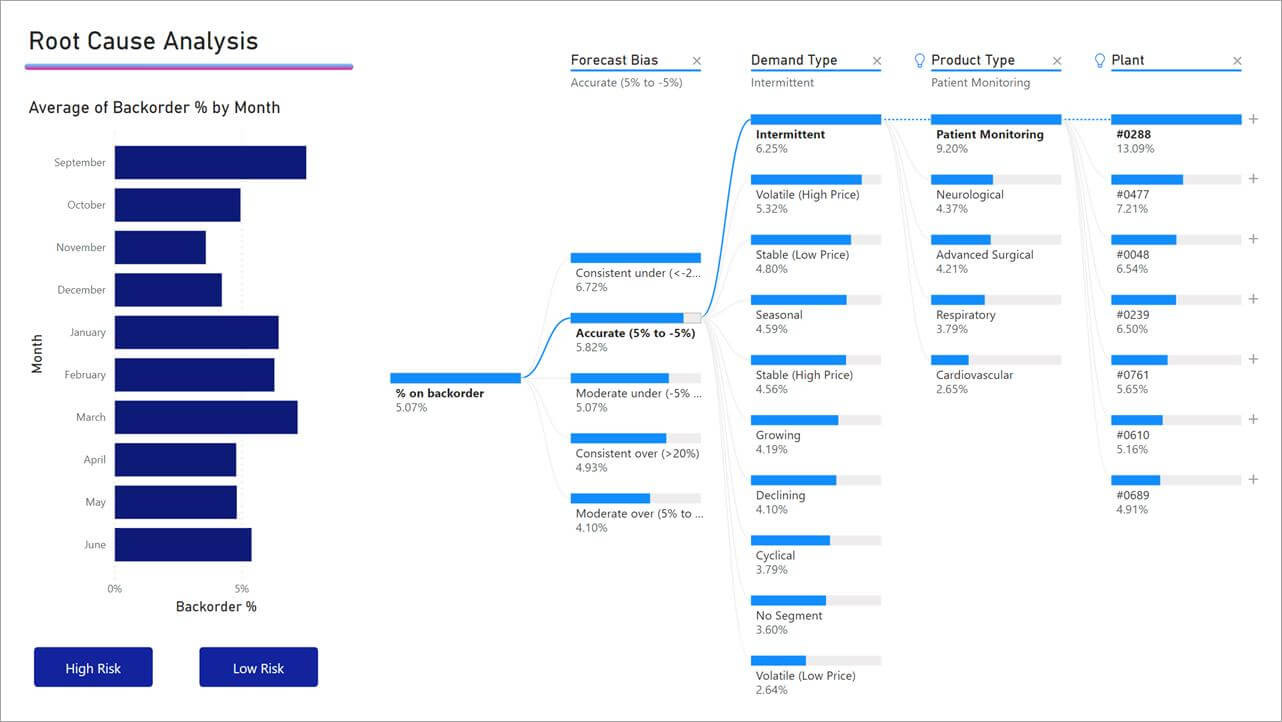
This not just helps you in analyzing the data but also helps you in explaining the whole way how you have come up with the figures.
Currently, Power BI has been loaded with numerous features. These features make it a perfect option for the future of enterprise analytics platforms.
Among various new features, ‘Key Influencers’ is one of the most talked visualization features powered by AI. It runs multiple statistical analyses to offer you an outcome. Here, you need to add up factors based on which the system will provide you with the right result.
This can be well explained with the help of two different examples.
Power BI services is mostly used in hotels today to keep track of the guests visiting the hotel. You can effortlessly analyze the reservation operations, red-flag issues, and reporting. It will also let you process the incredible amount of visitors data from disparate systems, turning it into actionable insight, in real-time.
Power BI analytics is also useful in shipping industries. You can easily analyze the shipping consignments that are going to be delayed. You can also use factors such as the area or the division from where the shipment is coming, and more.
So, how does it all happen?
Now since you’ve understood this Power BI, you will be intrigued to know how this happened.
The decomposition tree visual in Power BI lets you check out the various data levels to understand them better across multiple dimensions. It automatically collates data and enables drilling down into your dimensions in any order. It offers Artificial intelligence (AI) driven visualization, where you can ask and find the next dimension to drill down into, based on certain criteria. This makes it a valuable tool for ad hoc exploration and conducting root cause analysis.
This not just helps you in analyzing the data but also helps you in explaining the whole way how you have come up with the figures.
Power BI and Azure have extended many services to the enterprise levels to make things much more convenient than earlier. With the onset of further cognitive services, there will be more addition of features in Power BI. That means it is going to help you in creating an enterprise business intelligence system.
So, you can run proper analytics for your business. Power BI along with Azure are perfect enterprise analytics operating models to manage and analyze data automatically.
About Author

Content Architect
The goal is to turn data into information, and information into insights.
Related Blog
 Debadutta
.png)