×

Type In A Topic, Service Offering or Use Case To Search...

Data Visualization Services

Data Visualization Services

Supercharge your decision-making with advanced data visualizations and reporting techniques

Talk with our experts

Discover What Your Data is Telling You

63%

of business leaders believe data visualization helps them identify insights they might have missed otherwise [ 1 ]

90%

of information transmitted to the brain is visual, and the brain processes visuals 60,000 times faster than the text [ 2 ]

41%

of companies report reduced decision-making time when growth metrics are presented through data visualization techniques [ 3 ]

Diverse Partnerships for a Diverse You

We are the leading partner of the best technology providers, such as Power BI, Tableau, Qlik, and more, to help our clients adopt a suitable data visualization techniques.

  • Qlik
  • Power bi
  • Alteryx
  • Tabalue

Visualizations That Cover Every Branch

Strategic Dashboards

Gain a high-level overview of key performance indicators (KPIs) and progress toward strategic goals, enabling executives to align resources, monitor initiatives, and make informed strategic decisions.

Analytical Dashboards

Uncover patterns, trends, and correlations in data to support data-driven decision-making, empowering businesses to identify opportunities, mitigate risks, and drive performance improvement.

Operational Dashboards

Track real-time metrics and KPIs for efficient day-to-day operations, enabling teams to identify bottlenecks, optimize processes, and ensure smooth workflows.

Data Visualization
  • Discovery workshops and consulting on existing implementations for optimized performance and better reporting.
  • Complete wireframing to align dashboards with the user preference and usage patterns
  • Establishing dashboard requirements according to hierarchies and usage
  • Integration from different data silos to create a unified database
  • Self-service BI platforms to enable users with any ad-hoc reports & insights
  • Identification of different business use cases that can use analytics and reporting
  • Real-time and intuitive dashboards and reports tailored specifically for a diverse range of users
  • Seamless Data Extraction and Integration with visualization platforms to deliver an enterprise-grade solution
  • Custom training and mentoring of reporting systems to facilitate better adoption and productivity
  • Data pipeline and model optimization for seamless data processing and reporting
  • Enhancement of Semantic Layers for improvement in load times and performance.
  • Migration of data and reports from one platform to another
  • Flexibility to scale up or down as per user requirements
  • Upgrading from legacy visualization systems to a modern visualization tool
Embedded Analytics Services

Embed Your Visualizations for Seamless Usability

We break the shackles of traditional business intelligence tools to move beyond the boundaries of visualization and reporting. Our experts help you blend your analytics and data visualizations into your satellite systems so that you can achieve easy collaboration and better usability within a single platform.

Embedded Analytics

Persona-specific Dashboards for Hyperscaling Businesses

Unlock financial visibility, track cash flow, and monitor key financial metrics such as Working Capital, Budget variance, and Days Sales Outstanding (DSO) to make informed decisions and ensure long-term financial health.

Finance Dashboard

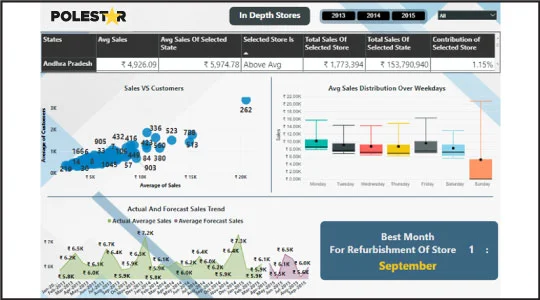
Empower your sales team with real-time sales data, analyze target vs actual growth, Average revenue per unit, and CAC, to identify opportunities and drive revenue and growth.

Sales Dashboard

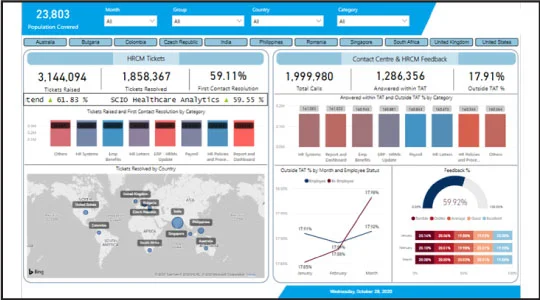
Streamline HR processes, track employee data, and monitor critical KPIs such as Training Costs, Talent Turnover Rate, etc.

HR Dashboard

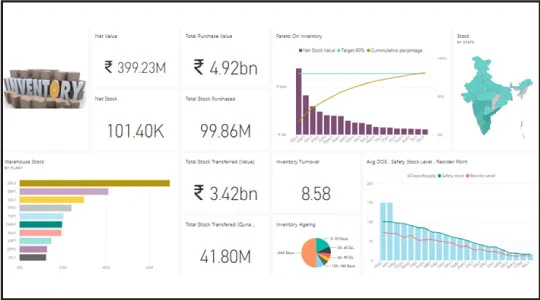
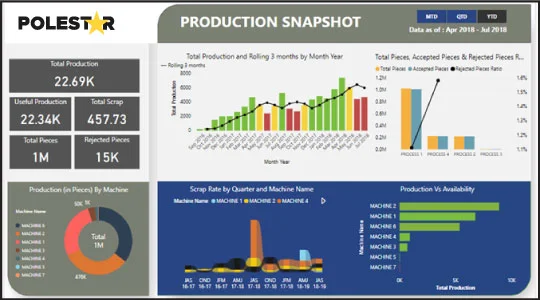
Gain real-time visibility into production metrics, monitor quality control, and optimize resource allocation to drive operational efficiency and minimize reduction.

Production Dashboard
Visualization

Need business-specific visual intelligence? We have your back!

  • Customizable dashboards catered to your business need
  • Visualization consulting and UX audits
  • Industry-specific reports with continuous support
Talk to our experts Explore our dashboard inventory

CXO Dashboards that Deliver at-glance Insights

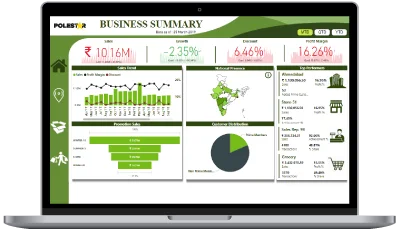
Grasp the heartbeat of your business with just a glimpse and a true bird's eye view of your business. We declutter the so-called 'Management dashboards' and provide CXOs with an awe-inspiring, panoramic view of their organization's vital signs, enabling them to pinpoint key focus areas and monitor business health effortlessly.

Why Polestar?

Client Success Stories

Fastest Growing FMCG
Fastest Growing FMCG Brand Streamlines Sales Data And Reporting System With AWS And Power BI

With our analytics solutions, this client was able to view their organization's sales performance from multiple aspects such as by customer, geography, product, sales representative, etc. Deeply insightful analytics dashboards helped them to get a holistic view of their customer sales data to analyze the entire sales process.

  • 78%

    Reduction in TAT

  • 8.2L

    Man hours reduced annually

  • 12%

    Profit increase in next quarter

View Case study
Fastest Growing FMCG
HCL Infosystem Revolutionizes the Decision-Making Process with Qlik Sense

Due to integration with Qlik Nprinting, users started receiving important reports through emails by 6 AM each day. Nearly a thousand reports were delivered spanning across every level of the hierarchy, allowing business users to gain critical information before starting their day.

  • 80%

    Increased usability with Qlik sense

  • 99%

    Reduction in human errors

  • 38%

    Increase in forecast accuracy

View Case study
Related Blog & Insights
genai data engineering
  • Data Engineering
  • Data Visualization
  • Gen AI
  • 16-Nov-2023
  • Ali kidwai
black friday trends and customer insights
  • Data Science
  • Data Visualization
  • Analytics Consulting
  • 09-Nov-2023
  • Lalitesh
Pricing Analytics
  • Data Visualization
  • Retail
  • Data Analytics
  • 23-Oct-2023
  • Sanya Gupta
Interested in learning more
about our Service Offerings?
Copyright © 2024 Polestar Insights Inc. All Rights Reserved.