Sign up to receive latest insights & updates in technology, AI & data analytics, data science, & innovations from Polestar Analytics.
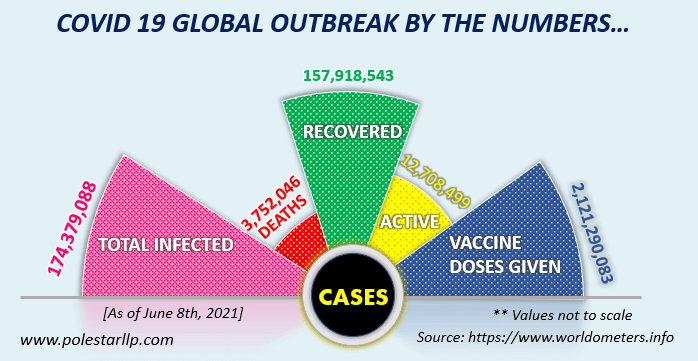
As Coronavirus reaches more than 159 countries with global cases topping 174,379,088 and the number of death tolls crossing 37 lakhs ( as of 7th June 2021), the whole world is doing its best to mitigate the virus.

“The World Health Organization has declared the coronavirus a global emergency. Here’s how public and governments are using analytics to track the outbreak.”
The World Health Organization (WHO) and the US Center for Disease Control are tracking the outbreak of what could become a world epidemic. It started in China, but it has spread to many countries across the world. The WHO declared the coronavirus outbreak a world health emergency on 30th January 2020.
Today we can see a big use case for analytics hitting the headlines. It’s one of those instances where lives depend on technology.
1. Visualization of Global Cases

Source: https://www.arcgis.com/apps/opsdashboard/index.html#/bda7594740fd40299423467b48e9ecf6
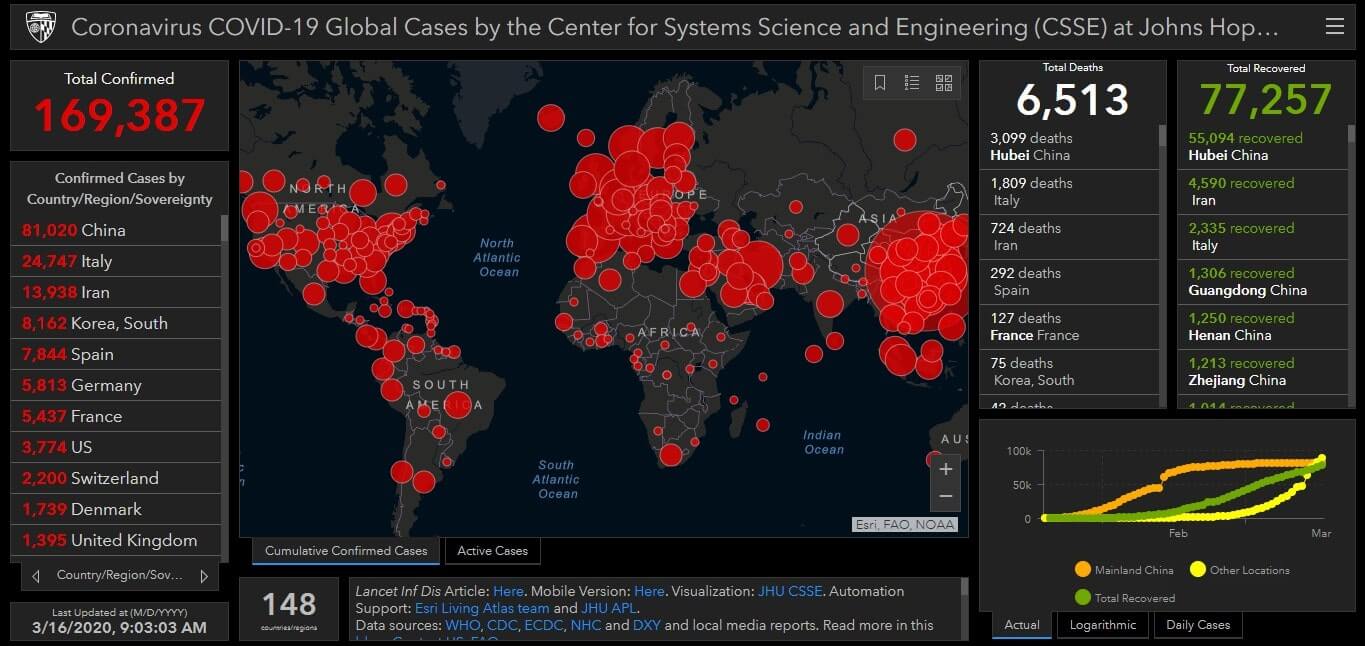
The Johns Hopkins University’s Center for Systems Science and Engineering has built a real-time visualization dashboard of the outbreak that includes – listings of total numbers of cases, maps, deaths, active patients, closed, and recovered cases.
The statistics are further broken down by countries and cases represented on the map by the size of the dot. The quoted sources include – CDC, WHO, and more. The university is using Esri’s ArcGIS (Geographic information system) for the visualization, which is published through the web. The dashboard is a beneficial way for the general public and doctors to track the status of the outbreak. And from this, people can also know how the CDC and other government agencies are analyzing the data.
According to, Theresa Do, professor of epidemiology and biostatistics at George Washington University and SAS analytics manager for infectious diseases epidemiology and biostatistics, says data, analytics, AI and other technology have a significant role to play in helping to understand, identify, and assist in predicting disease spread and progression. She knows how organizations use the data and analytics to make the right decisions.
2. Live-updates of Bed availability
We have seen that the Mumbai model of handling the crisis has been applauded by everyone. One of the key areas of such information relay is the dashboarding of the information like the availability of beds in a real-time basis such that doctors, physicians as well the government authorities can take relevant actions without delay. As such we can see how analytics is not only helping to analyze the past data but also the present data to ensure free flow of information.
Medical analysis to predict cancer recurrence, progression and response to therapy is advancing with the help of Big Data
3. GeoSpatial Analytics
Analytics has been helping doctors in identifying the hot-spots with the help of geographical data. For example – The suspected new cases would be tackled by physicians and then sent to the CDC for confirmation. AI and ML technologies will also help doctors and government agencies to track down the confirmed cases and come out with the information like – where they’ve traveled and who they came in contact with, to predict the spread. So, analytics that include Artificial Intelligence and Machine Learning can help organizations in this outbreak to learn from past events to create new knowledge swiftly from millions of data points.
Likewise, organizations can also go for syndromic surveillance which helps to track down the size, spread, and tempo of outbreaks, to monitor disease trends, and to provide reassurance that an outbreak has not occurred. Social media is often used as a sentinel source in this outbreak. In the future, technologies like smartwatches may play a crucial role, as data can track sleep and heart rates to provide early indications that a person is not doing well.
4. API Usage
Social media is often used as a sentinel source in this outbreak. In the recent past we have seen new websites showing the data of twitter for bed availability. Such ease of information is made possible by the use of API. Even websites that show availability of vaccines now, think of notification by 3rd party apps regarding availability of vaccines with CoWin.
5. Predictive analytics
Predictive analytics can also be applied to data from – airports, hospitals, and other public places to predict disease spread and risk. Hospitals can use the data to plan for the impact of an outbreak in their operations.
In the future, technologies like smartwatches may play a crucial role, as data can track sleep and heart rates to provide early indications that a person is not doing well.
The core lesson for IT in the outbreak is that data analytics has been helping fight Covid-19 and has evolved to be an underpinning to all types of organizations and operations. While analytics and ML aren’t sitting in local doctors’ offices taking samples to be tested, these technologies are being employed to help the overall effort and make doctors and healthcare organizations more efficient and better equipped to fight the spread of a virus-like coronavirus.
About Author

Content Architect
The goal is to turn data into information, and information into insights.