
Power BI is a suite of cloud-based, self-authoring business analytics tools from Microsoft that was released for general public availability in July 2015. At the time of the launch, Microsoft Corporate Vice President James Phillips explained the philosophy of Power BI when he said that it “sets the standard for modern business intelligence”. Since its inception, Power BI has been consistently recognized by the leading technology research firm Gartner as the leader in its Magic Quadrant for BI and Analytics.
Power BI has become very popular among business analysts in companies of all sizes and it has been reflected in its large-scale adoption among business users. Power BI features are very powerful with simplified data preparation, data discovery and data visualization steps of data analysis. Because of this, it reduces the dependency on the company information technology staff and benefits end-users to easily create reports and dashboards in a self-service manner, with rich and in-depth visualizations.
Power BI is at the forefront of the rise of modern self-service business intelligence technologies.
You can support your narrative and analysis with a wide range of in-built & custom visualizations from the Power BI visuals gallery. You can directly import and add these visuals to your dashboards/ reports in order to express your data in really interesting ways.
In short, Power BI is a highly robust, scalable, and cost-effective self-service end-to-end analytics offering from Microsoft that can accelerate your decision-making by providing your “knowledge workers’ ‘ with access to important KPIs at their fingertips and in real-time. When everyone is relying on data-driven insights to guide their decision-making, it will help your business run better.
Let us understand Power BI features and the advantages it will provide to the end-users and the stakeholders.
How Does Microsoft Power BI Connect To The Data?
There are two primary ways by which Power BI connects to and fetches the data from the OLTP systems
Using Import – Power BI will create a copy of the data in the cloud, which will be refreshed periodically, and the data models and analytics will be built on this data
Using Direct Query – The data will be updated live since the query will be working by directly connecting to the database
Learn how a Consumer Goods Multinational Enabled Effectiveness In Reporting And Decision Making With Power BI.
Some Powerful Features That Power BI Provides For Rich Data Analysis.
1. Robust Data Modelling And Stunning Data Visualizations
Power BI has a query editor, an integrated ETL tool, that lets you shape data (merge data & columns) that you have obtained from multiple data sources and create powerful data models with ease. With a powerful data engine, Power BI can support your complex enterprise analytics use cases. Microsoft has brought its long-time expertise with SSAS to deliver powerful Power Pivot and Power Queries. Power BI is also integrated with R, a popular language with statisticians & data scientists for advanced analysis, data mining and visualizations.
Power BI can support real-time reporting. You can effortlessly create in-depth and interactive visual analysis to create powerful data storytelling and lead your business users to do data discovery. You can choose from both in-built visuals or community-created custom visualizations, the list of each grows. You can then embed the visuals into your apps and portals or easily publish it to the web. Power BI, with its open SDKs, offers great custom visualizations.
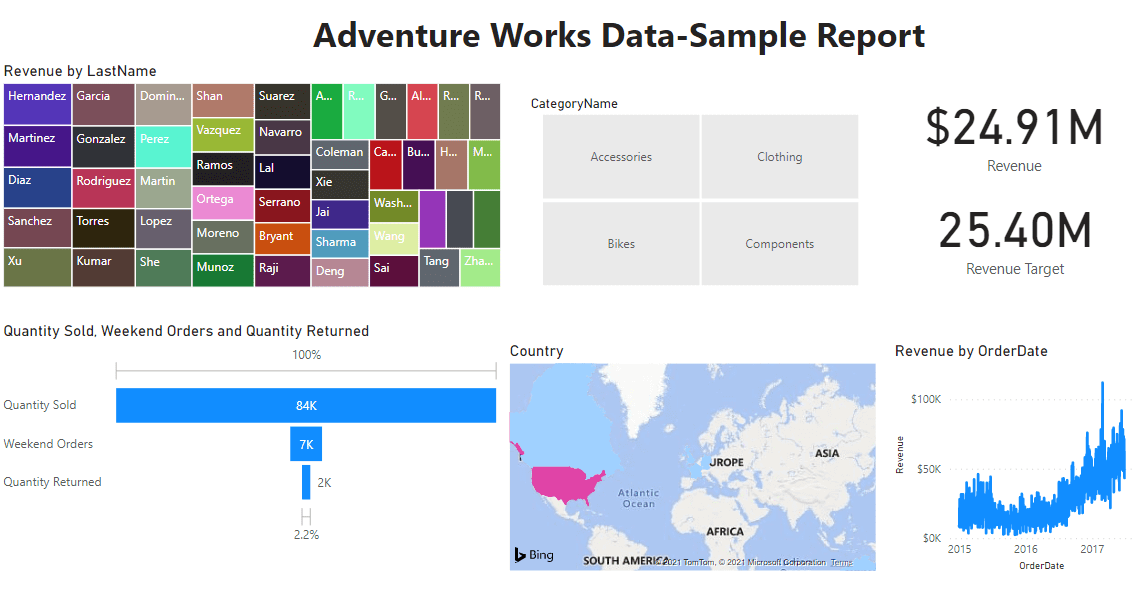
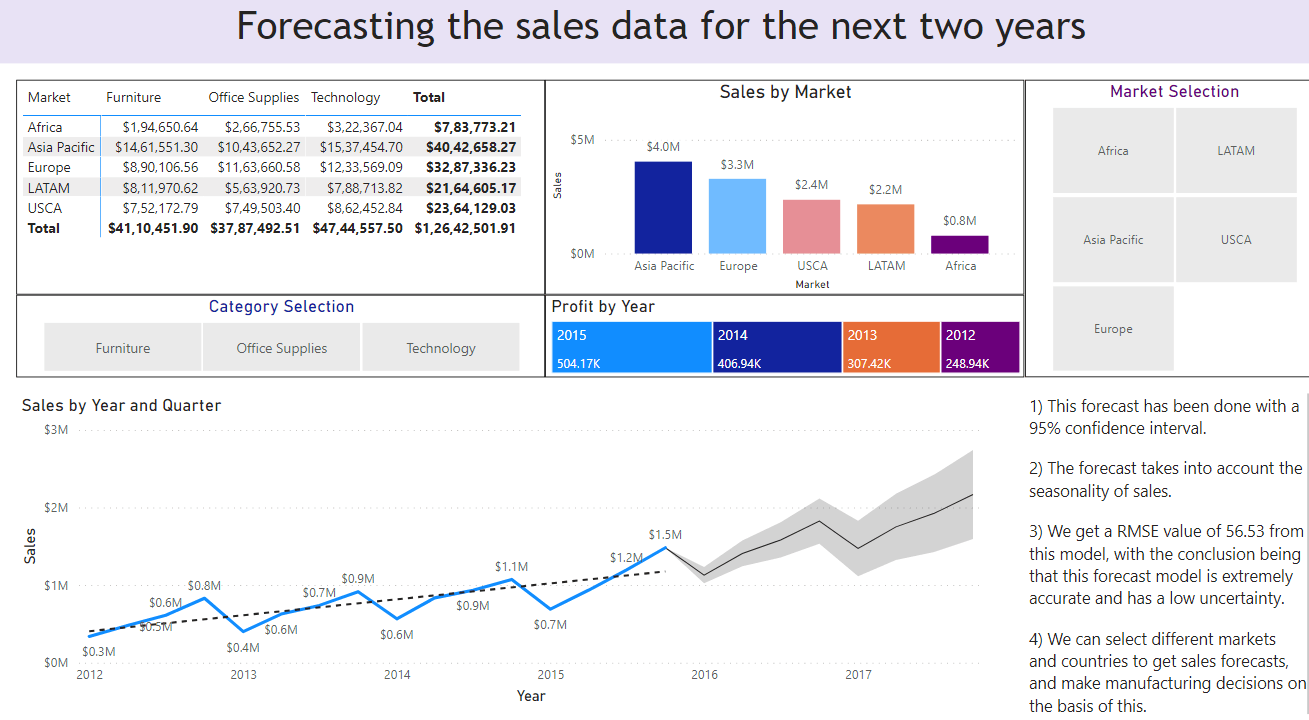
There are several standard visualizations available in Power BI. You can extend the functionality with custom visualizations. With the help of these powerful visual functionalities, you can perform drill-downs and drill-ups to take a closer look at your data at your desired level of granularity. Let us look at a few sample dashboards.
2. Integration With Multiple Tools
Power BI comes with multiple in-built connectors for you to help easily connect and join numerous on-premise, on-cloud and even streaming data sources for data preparation and analysis. Here, you can find the list of databases that Power Bi supports for datasets, including information about DirectQuery and the on-premises data gateway – https://docs.microsoft.com/en-us/power-bi/power-bi-data-sources
Power BI supports native Microsoft integration with Cortana, Excel and other Microsoft apps and services. You can even take out data dumps from Power BI in excel format in order to do further analysis on it. This makes it very easy to work with Excel and Power BI together. You can directly publish to Power BI from Excel 2016.
3. SaaS Offering
Power BI comes as a flexible and scalable SaaS offering. There is no upfront license fee along with installation and configuration costs. You don’t have to worry about making updates at regular intervals.
With Power BI, you can easily upscale and downscale on your investments as per your usage and scale across the enterprise as needs and requirements change.
This reduces your time to benefit from your purchase. You don’t have to worry about managing and maintaining expensive servers. You don’t have to worry about downtimes and interruptions. This makes it a very cost-effective solution for your enterprise requirements.
4. Security
Power BI complies with stringent industry-benchmarked data standards with the compliance verified by third-party audits and certifications. With its robust built-in governance, you can manage your data assets and control how your data is accessed and used.
This simplifies data management and ensures that your data assets are protected. It helps keep your data secure, giving people access to data and insights that they need. You can then securely share the insights with your team within your organization or even send it outside your organization over email. Security features in Power BI help to control the access to data in a granular way, so that data does not get misused.
There are a number of features available in Power BI that ensures data security. Admins can define restrictions at row level – which is known in Power BI as row-level security. Row-level security becomes important if several people in different departments have access to the same report.
For example, the managers of India or Singapore should see only data relevant to their area, even if all of them use the same report. You can also set privacy levels for group workspaces.
5. Lets You Collaborate Easily
Power BI enables you to work together with your team across departments and hierarchies with a single view of your data. With organization content packs and group workspaces, you can share dashboards, reports and datasets within your organization that gives users a personalized view of their metrics. You can use Power BI Groups in order to collaborate with team members and key stakeholders, ensuring that everyone is on the same page. You can have productivity discussions with your colleagues with the Power BI presentation mode. Power BI app workspaces are great places to collaborate with your colleagues on dashboards, reports, and datasets and create apps. It is integrated with Office 365 and you can have group conversations via O365. Share Power BI content easily with anyone via email whether inside or outside the organization.
#6 DAX
DAX, which stands for Data Analysis Expressions, refers to expressions for making calculations. Power BI uses standard DAX expressions ( just as in excel) for creating data models. Therefore, it makes it familiar for users that are well- versed with excel.
#7 Other Features
Power BI comes with out-of-the-box content packs for dozens of data providers, making it easy for business users to connect to data and experience their data without technical setup. With automated quick insights, you can run quick insights to generate interesting interactive visualizations based on your data. With mobile apps, you can react to changes on-the-fly. Now with Power BI reporting server, you can also get the solution on-premise and it is compatible with SSRS. Publish to the web with a single click to embed the visuals and analysis into blogs or websites. Some other interactive features within Power BI are:-
Navigation pane: With the navigation pane, you can smoothly shift through datasets, dashboards, and reports.
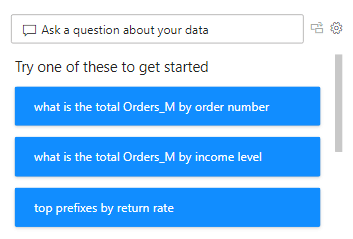
Q&A question box: The Q&A question box allows you to explore data by asking a question in natural language. The technology uses rephrasings, autofill, suggestions and more to help you find the correct answer the first time.
Help & feedback buttons: These are resource buttons for settings, downloads, getting support and providing feedback to the Power BI team.
Office 365 app launcher: This allows you to quickly open the Office 365 apps you want and need.
APIs– Powerful integrations between Power BI and other applications and services are possible.
Know more about Power BI vs Tableau vs Qlik to understand what fit's your organization's requirement .
Power BI Pricing Plans
Power BI comes in 4 different plans, each with separate pricing. You can check out their pricing here – https://powerbi.microsoft.com/en-us/pricing/. The free service is designed for individual users and offers just 1 gigabyte (GB) of storage along with daily refresh cycles. Enterprises will want to go with the Professional version, which has more data storage (10 GB), faster data fresh cycles (hourly), streaming data consumption (1 million rows per hour compared to the 10,000 rows per hour offered in the free tier), and collaboration features.
- Desktop App – It comes as a freely downloadable application
- Power BI Pro
- Power BI Premium
- Power BI Reporting Server
Final Verdict
If you’ve made it till here you must have understood the benefits of Power BI, how it lets you create rich analytics reports with visual analytics at your fingertips. Frost & Sullivan named Power BI the lowest-cost solution. As the milestones and the scope of business intelligence continue to evolve, Power BI will be the ideal partner for your strategic initiatives. Microsoft very actively listens to the feedback from the user community and regularly innovates with monthly updates. Being a SaaS offering, these updates are automatically included in your subscription Power BI software.
Find out how Polestar has delivered success with Power BI Services across organisations and if you want such success to be replicated within your organisation Contact Us.


