
Did you know?
Dogs can increase our dopamine, serotonin, and oxytocin level, these are the so-called “happy hormones”. Though petting them is better, even looking at pictures can help release these hormones into your system making you feel happier (Though it works best if it’s your dog).
Not to mention the obvious, but sometimes the opposite i.e. activation of pain simulators happens when we try to read something challenging, especially things like Machine Learning and Predictive Analytics for most people (sometimes me too).
So, if you are wondering how I diverted to the techy not-so-loved stuff from the loved-by-all dog topic. Just stay with me for a bit.
This article is all about combining these edges to find the middle ground for your brain receptors! Why not use these happy hormones to do more than those endless screen scrolls and use them to do some learning?
The Big “B”: Big Data

Let’s start with the place all this began, the data itself. Though nowadays the pace at which data is being generated with organizations it is synonymous with “Big Data” itself. Technically speaking, you can categorize data as Big Data only when it has the following characteristics (which was known as 3Vs previously, not with the increasing data it has also become 5 Vs):
Volume: High Volumes of data with multiple structures
Velocity: High speed with which it is being accumulated
Veracity: Inconsistent and uncertain i.e. more unstructured and semi-structured data
Variety: data sourced from heterogeneous sources structured, semi, and unstructured
Value: Both in monetary terms for storage and the value that comes from analyzing or storing it.
Because of these parameters, it makes it difficult to analyze the data easily. The structure might not be defined, data might be from multiple sources, and data would lose relevancy if not analyzed at the appropriate time. Hence, enter Data Analytics.
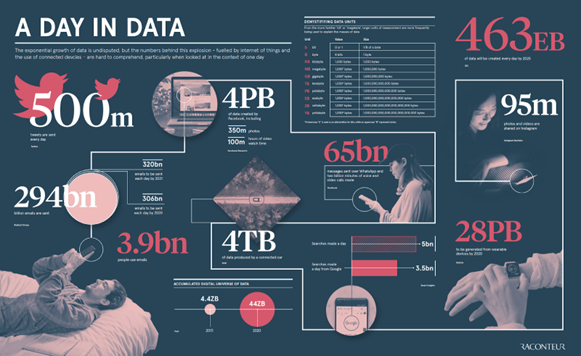
P.S. Not a dog meme but this is how large the data is now.
Source: World economic forum
Data Analytics

No, we are not asking you to write Macros or Lookups for us. But when you analyze your data with excel it has the risk of being lost i.e. no single source of truth, and it is not possible to get real-time analysis easily. But again before you suggest Machine Learning (which we are going to talk about in just a while), there is another alternative. Business Intelligence tools.
With Business Intelligence tools like Power BI, Qlik, or Tableau, you can analyze your data seamlessly and derive significant insights while creating dashboards that are easy to understand.
Some of the advantages of using Business Intelligence tools (each tool has its advantage again)
- Powerful Data modeling
- Plug and Play Visualizations
- Integration with applications
- SaaS offerings
- Advanced data modeling capabilities
Machine learning
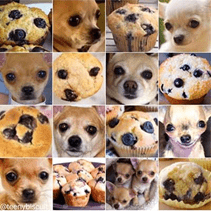
Most of you must have seen this meme, where they talk about confusing the Machine Learning algorithm, about how it is difficult to distinguish between the chihuahuas and muffins, it is possible to do so. Though we’re not going deep into how we found an amazing article about how to do the same.
Machine learning is the type of Artificial Intelligence wherein you create applications that get better over time with more and more data. It is how social media takes note of your interactions like clicks, and shares to make it seem like the internet is flooded with things that you are interested in and to keep you hooked. It is similar to training a dog, by giving a dopamine rush during training you keep it hooked to perform the same acts again and again.
There are four basic types of Machine Learning: supervised learning, unsupervised learning, semi-supervised learning, and reinforcement learning. Depending on the data and the analysis requirement one of the four is done.
Supervised Learning
This involves training with well-labeled data and then giving the test set of data to check how correct it is. In the above example, it’s like teaching the application with images of chihuahuas and muffins separately with labels first and then trying to identify what they are with the test data. Common types of supervised learning are Classification (for qualitative or categorical data) and Regression analysis (for quantitative data or values)
Unsupervised Learning
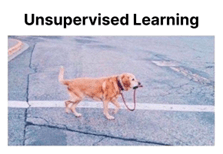
Though most of the definition is in the name itself, unsupervised learning involves training a machine with no classified or labeled data and therefore with no guidance. Though it feels like unleashing a dog and letting it go as it wants, like in the image below. But it is to be understood that unsupervised learning is mostly used for clustering or association which is normally done with characteristics of the inherent data.
Semi-supervised Learning
A mix of both of the above models, by providing labeled data for training but letting the model take its course and having it explore on its own to make appropriate analysis.
Reinforcement Learning
The goal of reinforcement learning is to find the best possible behavior or path it should take in a specific situation. In supervised learning, while training the data the answer key is also provided along with the question, and in reinforcement learning, there is no answer key, the model is trained to find the optimal path (Eg. Chess). In case there is no training data the model is trained on its own data.
Conclusion
Though it seems easier, we are not asking you to use dog memes for communication (even though most of us might prefer it), sometimes it's easier to learn with a serotonin boost. But ultimately, no one wants to be this:

So if you are looking for that extra help you need with your Data science projects or Business Intelligence projects, we can help you in creating them. Or if you’re not sure what to do about it, then take our intensive Data Discovery workshop.


