The world of analytics and data visualization is moving fast, with new players hitting the market. Business Intelligence makes sense of the modern data landscape, which grows increasingly more digitized and complex. It follows that picking the right Business Intelligence platform for your organization makes all the difference in deriving significant insights from your data and making better business decisions.
So how do you choose? Comparing industry leaders can be an excellent place to start, so we reached three of the top BI platforms – Tableau, Qlik, and Microsoft to help guide you in your software selection process.
This blog intends to help you choose the right business intelligence (BI) platform that meets your organization's BI needs. Let's dive.
Tableau Software
Tableau Software was established on the idea that subsequent reports and data analysis should not be isolated activities in the organizations but should be integrated into a single visual analysis process—one that lets users swiftly see shifting views on the fly and patterns in their data to follow their train of thought.
Tableau combines data visualization and data exploration in an easy-to-use application that any user can quickly grasp. Anyone comfortable with Excel can create rich, interactive analyses and powerful dashboards and share them securely across the organization. IT teams can manage meta-data and data centrally, control permissions, and scale up to enterprise-wide deployments. This flexibility assists IT organizations get out of the reporting backlogs and empower business users to be self-reliant.
Now Let's Study All The Tableau Products Suite One By One.
Tableau Desktop
Tableau Desktop is a BI and data visualization tool that can be utilized by anyone. It helps in transforming boring tabulated data into eye-candy representations and graphs. With tableau desktop, users can access real-time data analytics by directly connecting data from DW. Users can easily import their data into Tableau's data engine from numerous sources and integrate them by combining various views in an interactive dashboard.
Tableau Server
Tableau server arrives with all the attributes of Tableau Desktop along with the capability of networking. With Tableau Server, users can share dashboards created in Tableau Desktop. This makes it a perfect selection for enterprise-level reporting and projects. When implemented with real-time data processing, this can become a very powerful and dynamic tool for ensuring instant communication of data and insights.
Tableau Online
This is a hosted version of the Tableau server. It is usually powered with the assistance of cloud computing to make the software available to everyone. This enables easier and faster access to BI on the go. Users can publish dashboards created in Tableau Desktop and share them with colleagues in an easy way.
Tableau Reader
This is the free desktop version of Tableau. Its attributes are limited to only viewing the visualizations created in Tableau. That means that you can filter and drill down the data but cannot edit or perform any edits or interactions.
Tableau Public
This is a free version of Tableau software that can be utilized to make visualizations. The downside is that you need to save your workbook and visualizations in the Tableau Server, which can be accessed by anyone.
Now That We Know About Tableau Products, Let's Navigate Around Its Architecture.
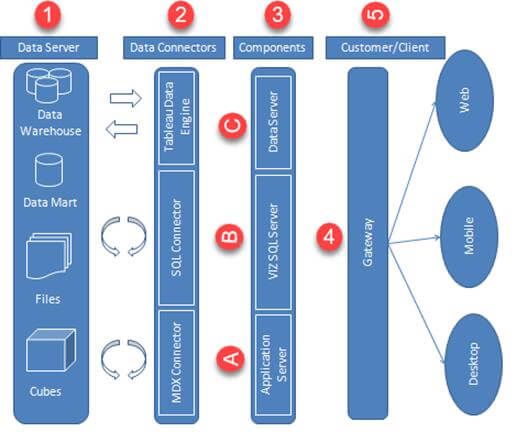
Source: Tableau
Tableau Software is designed in a way to connect various data tiers. It can connect clients from mobile, desktop, and web. It is a reliable data visualization tool. It is highly secure and available. It can run both on physical and virtual machines. It is a multi-user, multi-process and multi-threaded system.
Providing such powerful features requires a robust architecture. Let's study Tableau software architecture.
The customer data layer carries all sorts of data sources available to a Tableau user, such as data warehouses, data marts, and relational databases.
Next are the layers of data connectors, consisting of a data engine, SQL connector, registry, and MDX Connector. Such components are capable of communicating with the data sources directly. The Data Engine processes user requested data and determines the kind of data. It defines whether it is a component or a metric and generates data extracts. The engine runs a SQL Connector at the data context, which generates a SQL query for all user interactions and requests with the data sources. Moreover, the SQL Connector deals with data marts and flat files. The MDX Connector likewise deals with multidimensional cubes.
The next layer includes all the essential components, the data server that tracks and controls the operation of the Data Connector layer components. This consists of a VizQL Database and Application Server. To access the visualization, the application server ingests all user requests that come from - smartphones, browsers, or Tableau Desktop. It tackles the demands, identifies the kind of request, grants access, and accordingly checks user authorization. The VizQL Server is a Tableau component; it refers to the language Visualization Query.
It is utilized behind the visualization logic of Tableau and creates visualization as per the dashboard instructions.
Now comes the Tableau Server gateway, where any query or hat the client sends first hits the load balancer or gateway. A gateway is a primary server that receives the queries and redirects them to the secondary server, known as a work server.
Another best way of managing the architecture for the Tableau Server is through a tier-based model. Users can divide architectural components in such a model into three parts - consumer tier, storage tier, and management tier.
Now Let
1. Collaboration And Sharing
Tableau offers convenient options to collaborate with other users and instantly share data in the form of sheets, visualizations, dashboards, and more, in real-time. It provides you to securely share data from numerous data sources such as on-cloud, on-premise, hybrid, and so on. Easy and instant collaboration and data sharing help get quick feedback or reviews on the data leading to a better overall analysis.
2. Modern Cloud Analytics
Modern Cloud Analytics (MCA) combines the resources, technical expertise, and data knowledge of Tableau, Amazon Web Services (AWS), and respective partner networks to help you maximize the value of your data and analytics investments and your end-to-end analytics journey. From strategy to migration to operations, this collaboration allows you to securely deploy and scale your cloud analytics practice without compromising data integrity, governance, or security.
3. Live And In-Memory Data
Tableau makes sure that the connectivity to both live data extraction or data sources from external data sources as in-memory data. This provides the users with the flexibility to utilize data from more than one type of data source without any limitations. You can utilize data directly from the data source by organizing live data connections or keep that data in memory by extracting data from a data source as per their needs. Tableau offers additional features to support data connectivity, such as automatic extract refreshes, notifying the user upon a live connection failure, etc.
4. Trend Lines And Predictive Analysis
Another handy feature of Tableau is the use of forecasting and time series. Easy creation of forecasting and trend lines is possible due to Tableau's powerful backend and dynamic front end. You can quickly get data predictions like forecasting or a trend line by drag-and-drop operations and simply selecting some options using your concerned fields.
5. Mobile View
Tableau acknowledges the significance of mobile phones in the present world and offers a mobile version of the Tableau app. One can create their reports and dashboards in such a way that it is also congenial with mobile. Tableau helps users with creating customized mobile layouts for your dashboard specific to your mobile device. The customization option gives the opportunity for interactive offline previews, adding new phone layouts, etc. Therefore, the mobile view gives Tableau users a lot of flexibility and convenience in handling their data on the go.
6. Robust Security
Tableau takes exceptional care of user security and data. It has a complete security system based on permission and authentication systems for user access and data connections. Tableau also offers its users the freedom to integrate with other security protocols like- Kerberos, Active Directory, and more. Most importantly Tableau practices row-level filtering, which helps keep the data secure.
Empower your enterprise to analyze, forecast, and publish intuitive reports for informed decision-making with our tableau analytics services.
Qlik Analytics Platform
The Qlik Analytics Platform (QAP) is a developer platform for building custom analytics apps based on rich backend APIs and frontends. It offers users full API access to the powerful Qlik Associative Engine to make intelligent, data-driven data analysis applications. Users can extend, develop, and embed visual analytics in apps or portals from anywhere, all within shared governance and framework.
It provides the same core engine used to build QlikView and Qlik Sense developers. That means organizations can make the solution they require in the way they want, safe in the knowledge that it is powered by Qlik’s industry-leading, patented technology.
Qlik gives organizations business agility – from upstream data preparation and data sourcing to visualization and sophisticated analytics and reporting and downstream collaboration. Most significantly, everything takes place within a governed framework, offering enterprise trust and scalability.
The core purpose of the QAP is to meet the requirements for embedded analytics in every situation. Users get straight access to the market-leading associative in-memory engine, on which all Qlik analytics products are based. So, developers can indulge inflexible conditions that allow them to create precisely the solutions that are needed. Advanced, open standard APIs such as Mashup API, Extension API, Engine API, and Backend Management APIs also offer advantages.
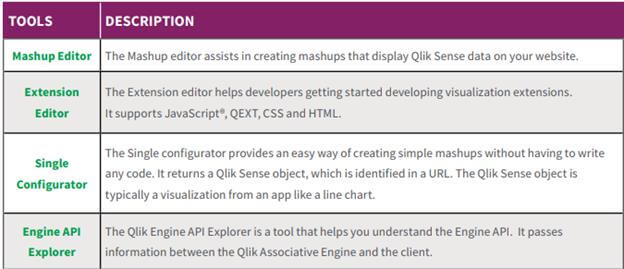
Qlik Dev Hub
Qlik Dev Hub is a developer workbench for building custom apps, embedded analytics, and extensions that allow more accessible access to the capabilities in the Qlik Analytics Platform. Qlik Dev Hub comes with several visualizations and mashup templates and can be used for getting started building custom visualizations and mashups. See below:
Qlik Management Console (QMC)
The Qlik Management Console (QMC) is a web-based application for administering and configuring the Qlik Sense site. The Qlik Management Console connects users to the central Qlik Sense node, where all system data is stored and with all local nodes synchronized at the same place. Even if users have a multi-node, geographically distributed Qlik Sense installation, the QMC enables you to perform the following from one location:
Manage content security (by security rules)
Manage tokens and access types
Manage data connections
Configure nodes
Manage tasks and triggers
Manage licenses
Synchronize content
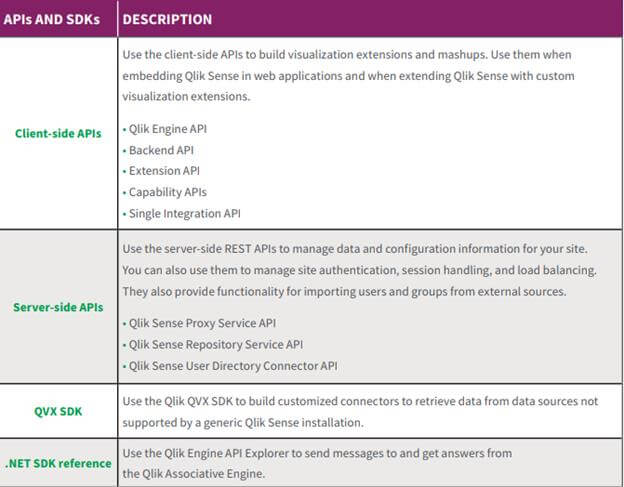
Qlik Sense APIs and SDKs
Qlik Analytics Platform offers a range of APIs and SDKs built on open and standard web technologies. They include:
Qlik Associative Engine
Qlik Analytics Platform offers direct access to the Qlik Associative Engine (QAE). The engine is the 2nd generation of proven and patented engine technology-powered Qlik products for the last decade. It offers dynamic calculations and associative data indexing that empower people to naturally explore data, allowing them to see all the connections in their data. The associative data indexing exposes relationships in complex, multi-source data sets that would be hidden in hierarchical or query-based approaches.
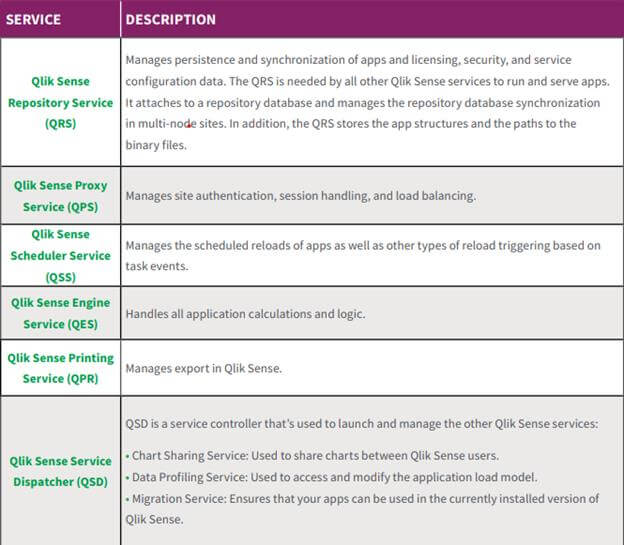
Qlik Sense Supporting Services
The Qlik Sense supporting services, which run on the MS Windows operating system, can be deployed in various ways on a node to suit various deployment purposes. They include:
Qlik Platform products
Qlik View
QlikView is a leading Business Discovery Platform. It is unique in numerous ways as compared to traditional Business Intelligence platforms. As a data analysis tool, it always maintains the relationship between the data and this relationship can be seen visually using colors. It also shows the data that are not related. It provides both direct and indirect searches by using individual searches in the list boxes. QlikView's core and patented technology has the feature of in-memory data processing, which gives superfast results to the users. It calculates aggregations on the fly and compresses data to 10% of the original size. Neither users nor developers of QlikView applications manage the relationship between data. It is managed automatically.
Qlik Sense
Qlik is a fully integrated cloud-ready platform powered by the patented QIX associative indexing engine. Qlik's Associative engine brings together all your data so you can explore without limits. You'll call it the most powerful competitive advantage in a data-driven world. With its intuitive exploration and visualization, advanced analytics, and self-service data preparation abilities, Qlik Sense combines enterprise governance and readiness, allowing organizations to meet the range of BI use cases from a single platform leading to data-driven decision-making.
Qlik Data Integration (QDI)
In today's hyper-competitive business environment, real-time insights are evaluative. Users need agile analytics and robust data integration solutions to make fast decisions. Unlike traditional ETL scripting and batch data movement — which are slow, inflexible, and labor-intensive — the QDI platform automates the creation of data streams from core transactional systems. It efficiently moves data to applications, warehouses, and lakes — on-premise and in the cloud — and makes data immediately available. With Qlik, users get the frictionless data agility they need to drive more excellent business value. It refers to the processes or technologies used for extracting data from disparate data sources and then transforming, filtering, consolidating, and delivering that data to users. Data integration includes replication, which allows organizations to break down the barriers separating their data stores and applications and make different types of data available and usable across the organization while enabling enterprise-wide reporting and analytics.
The QDI Platform is a complete solution with all crucial functions for DataOps for Analytics. It is the core of Qlik's advanced data integration capabilities. It helps organizations address the complex challenges of swiftly transforming data into business value. With its innovative data integration expertise and technology, Qlik offers end-to-end solutions for analysis and data integration. The Qlik Data Integration Platform offers capabilities to integrate enterprise data through cross-platform data streaming and automated analysis-ready data sets. These processes directly support your company's transition to real-time analytics and the cloud. It also enables your organization to not only accelerate access to your data but also reduce the cost of distributing, sharing, and ensuring data availability.
Qlik SaaS – Business and Enterprise Edition
In the SaaS model, users can select between two services: Qlik Sense Enterprise and Qlik Sense Business. Both versions of the system are available in the SaaS model, which means they are hosted and managed by the providers in the Qlik Cloud Services in a highly scalable cloud infrastructure.
This is the complete implementation option and is a great option for organizations that, along with the cloud model, want to gain major control over user access and use increased capacities for individual applications. This solution can be done independently or as part of a Multi-Cloud implementation, and this version offers a broader choice to the users.
Here Are The Key Highlights Of The New Features
Analytics Modernization
Customers are swiftly moving to the cloud, and the pandemic only accelerated the pace of that adoption curve. This year, Qlik delivered both capabilities and programs to help customers seamlessly adopt the cloud for analytics to match their speed and needs. In April, it launched adoption programs and new packaging, which includes new packaging of Client-Managed options and Qlik Sense Enterprise with SaaS, plus a direct path for QlikView customers to adopt Qlik Sense SaaS- Enterprise with the ability to host their QlikView docs in the cloud.
Continued Industry Leadership in Augmented Analytics
Throughout the year, Qlik continued to add its leading portfolio of augmented analytics capabilities natively built into Qlik Sense. Early in the year, it added support for multiple languages and business logic to make insights more applicable and relevant to a broader audience of analytics users across customer organizations.
A new release in the Qlik platform saw a significant set of enhancements to Insight Advisor. It built a conversational analytics experience – Insight Advisor Chat – into Qlik Sense, added a new business logic layer for customization of insight generation, and natural language processing; and, introduced on-board advanced analytics calculation to complement the real-time integration capabilities.
Intelligent Alerts
Qlik is rapidly rolling out alerting capabilities into the overall product sets. In May 2020, they launched Qlik Alerting as a value-added product for Windows customers, and, in the fall, they fully integrated and included Data Alerts for SaaS customers also. Sophisticated, data-driven alerts directly from Qlik Sense empower customers to manage by exception and respond quickly when issues arise proactively. Its advanced data-driven features, including statistical trending and calculation, help customers spot outliers and anomalies.
More Visualizations
This year the Qlik platform is accelerated to bring in world-class visualization capabilities to Qlik Sense. Qlik maintained breakneck speed from 2019, adding over 50 new visualization and dashboarding enhancements in 2020. In the present scenario, there is a broad library of best-in-class visuals – intelligent, beautiful, responsive, and interactive, driven by the power of an associative engine to calculate analytics and manage context at the speed of thought. Users may also check out the Visualization Showcase, which is updated regularly.
Our extensive qlik consulting service helps organizations build a data-driven enterprise by scaling qlik platform to achieve faster time-to-market.
Microsoft Analytics Platform
Microsoft Analytics Platform System (APS), is a data platform designed for big data analytics and data warehousing. Microsoft has products for analytics (SSAS), data integration (SSIS), business intelligence (SSRS), and visualization. These tools can be deployed either stand-alone or as part of a SharePoint system. They can be fully integrated with the MS Office desktop products such as Excel.
Azure Stream Analytics
SQL Server Integration Services (SSIS)
Microsoft Integration Services is a platform for building enterprise-level data integration and data transformation solutions. Use Integration Services to solve complex business problems by copying or downloading files, loading data warehouses, cleaning and mining data, and managing SQL Server objects and data. Integration Services can extract and transform data from various sources such as XML data files, flat files, and relational data sources, and then load it into one or more destinations. Using SSIS, organizations can implement an appropriate information management foundation to deliver integrated, accurate, and timely data across their enterprise.
SQL Server Analysis Services (SSAS)
Analysis Services is an analytical data engine used in decision support and business analytics. It provides enterprise-grade semantic data models for business reports and client applications such as Power BI, Excel, Reporting Services reports, and other data visualization tools. SSAS provides online analytical processing (OLAP) of data from disparate data sources. SSAS allows users to analyze data with a host of tools, including SSRS and Excel. In addition, SSAS enables the discovery of data patterns that may not be immediately apparent through the data mining features built into the product. Organizations can easily prepare and populate the data that drives the SSAS system and design and develop the SSAS cubes to organize your data.
SQL Server Reporting Services (SSRS)
SQL Server Reporting Services (SSRS) provides a set of on-premises tools and services that create, deploy, and manage mobile and paginated reports. The SSRS services help empower their users to make effective, informed decisions based on trusted data and delivered in formats appropriate for them.
Azure
Microsoft has always positioned itself and throw more focus on enterprise customers. With extensive investments in windows, outlook, dynamics and other well-known applications for small, medium, and large enterprises. They find it more accessible and often more cost-effective in onboarding with the Azure ecosystem.
This gives Azure an important advantage over its rivals, for instance, AWS. Azure is a cloud computing service that came to live in Feb 2010 by Microsoft to manage and access resources. In the present scenario, Azure is the fastest-growing and the second-largest cloud computing platform in the market. More than 90% of Fortune 500 companies presently use Azure for their numerous workflows.
How it's suitable for business users?
Azure services are basically divided into 18 categories, containing 200+ services, with more than 50+ data centers in every central geography around the world, Azure offers support for numerous languages like- Node JS, C#, Java.
With Azure Services, clients can create a virtual machine for Linux or windows with seamless configurations in a fraction of a second. The Azure Service Fabric eases microservice development and apps lifecycle management. Azure CDN is used to deliver high bandwidth content to users across the world fast and cost-effectively. Azure Express Networks gives on-premise networks to connect to Microsoft Cloud through a secure private connection. Azure DNS enables you to host applications.
Conclusion
Overall, we can say that all tools work on different principles and technologies. So, if you are looking for a pure-play analytics platform, then toss a three-sided coin and decide. These analytics platforms help organizations lead with data to see more.


