
Over the years, we've had a front-row seat to digital transformation occurring across all industries and regions worldwide. And in 2020, we've seen that digitally transformed organizations have successfully adapted to sudden disruptions. What lies in the middle of the digital transformation is also the underpinning of organizations that have proven most resilient during turbulent times—and that is data.
Data enables both analytical powers to analyze the past and gain new insights and predictive power to predict the future and plan. In the current scenario, many of Microsoft's services are built on Azure. Still, the company is increasingly giving Azure services such as -Azure Data Lake, Azure synapse, Azure migration, and more to clients to extend and customize their offerings.
As more and more data moves into the cloud, businesses have more and more data sources to get insight from, first business intelligence, and now enterprise analytics have been moving into the cloud as well. Previously organizations were using Excel, Power Query, and SQL Server analysis services, now they are utilizing Power BI and the Azure data services to create the analytics solution to compete for the business demands.
Have you recently come across some new features of the latest Power BI?
• A new smartphone emulator
• Page refresh is now automatic.
• New options in collapse and expand icons.
• Modern ribbon
• Row-level security is available in the data type gallery of excel for featured tables.
With so many new features available, Power BI is now even more potent than before. A high number of enterprise owners today depend upon Azure and Power BI. The technology helps them in maintaining their data and other requirements.
Data is the most crucial element today; everyone is aware of this fact by now. Power BI offers you the freedom to do several activities with the data. You can store, extract, and even transform data whenever you require it. Presently organizations are moving toward modern data management platforms such as Azure Data Lake, Azure SQL data warehouse, and Power BI.
Power BI makes use of automated machine learning for several activities, such as-
• Predicting the data that you have
• Analyze the data that is available in the form of text or images
• Build a separate model for machine-learning to run them.
So, today when organizations deal with a massive volume of data, Power BI is the perfect option to offer you help. This makes it quite clear why Power BI and Azure have become an essential part of any enterprise analytics.
Utilize enterprise analytics tools like Power BI and the Azure data services to create the analytics solution to compete for the business demands.
How power BI And azure can be the future of enterprise analytics solutions?
Currently, Power BI has been loaded with numerous features. These features make it a perfect option for the future of enterprise analytics platforms.
Among various new features, ‘Key Influencers’ is one of the most talked visualization features powered by AI. It runs multiple statistical analyses to offer you an outcome. Here, you need to add up factors based on which the system will provide you with the right result.
This can be well explained with the help of two different examples.
- Example 1:
Power BI services is mostly used in hotels today to keep track of the guests visiting the hotel. You can effortlessly analyze the reservation operations, red-flag issues, and reporting. It will also let you process the incredible amount of visitors data from disparate systems, turning it into actionable insight, in real-time.
- Example 2:
Power BI analytics is also useful in shipping industries. You can easily analyze the shipping consignments that are going to be delayed. You can also use factors such as the area or the division from where the shipment is coming, and more.
So, how does it all happen?
Now since you’ve understood this Power BI, you will be intrigued to know how this happened.
The decomposition tree visual in Power BI lets you check out the various data levels to understand them better across multiple dimensions. It automatically collates data and enables drilling down into your dimensions in any order. It offers Artificial intelligence (AI) driven visualization, where you can ask and find the next dimension to drill down into, based on certain criteria. This makes it a valuable tool for ad hoc exploration and conducting root cause analysis.
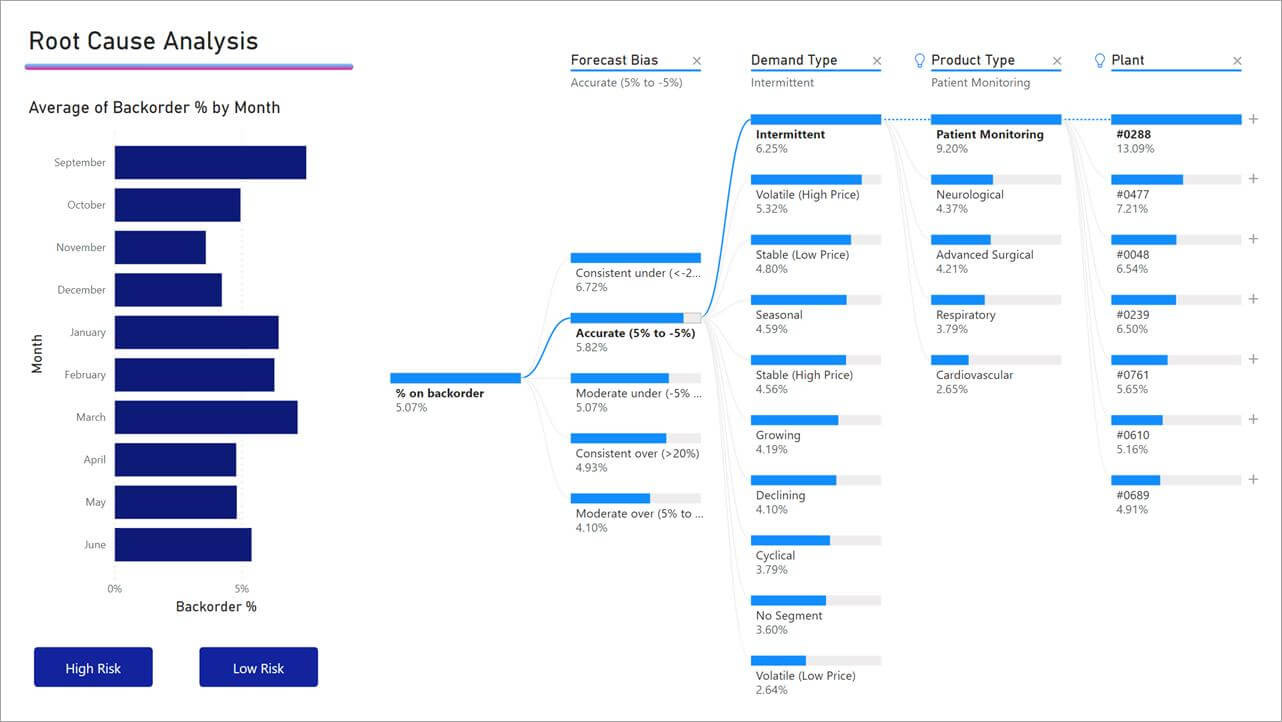
Source- https://bit.ly/2SC5K4L
This not just helps you in analyzing the data but also helps you in explaining the whole way how you have come up with the figures.
Final Thoughts
Power BI and Azure have extended many services to the enterprise levels to make things much more convenient than earlier. With the onset of further cognitive services, there will be more addition of features in Power BI. That means it is going to help you in creating an enterprise business intelligence system.
So, you can run proper analytics for your business. Power BI along with Azure are perfect enterprise analytics operating models to manage and analyze data automatically.