Thoughtful financial analysis requires as many words as numbers. But seeing the numbers in visualization prompts the question like Why the Gross Sales for the current year is less than the expected? Since numbers play a vital role in analyzing trends and help to better understand business insights, an intuitive visualization goes a long way in communicating complex information effectively as the human brain is coded to spot patterns and recall visuals.
But why are we talking about this?
A few days back, we received an opportunity to work on a QlikView project with an agro-based client. The objective was to create a sales finance dashboard to bring out business insights like revenue and EBITDA trend which could help improve the company’s operating performance. Needless to say, the dashboard required the use of multiple metrics and dimensions.
Though there are different ways to create an intuitive dashboard in QlikView. We will discuss one of the methods that use QlikView Text objects to create different shape objects like flower and star shape quadrants.
Creating Custom Shapes Using Text Object:
The text object is used to display illustrative information of the QlikView report being displayed. We can place them anywhere on the sheet and use them to show calculations based on valid expressions.
To obtain the above dashboard, follow the below steps to perform it:
Select the advanced styling mode option from the settings.
{Settings->Document Properties->General->Styling Mode-> Advanced}
Create a text object and select the below option to make the 1st flower quadrant
{Text object Properties->Layout tab and select the below checkbox and options}
Engage your visual perception and learn how to represent data and tell a good story through your data.
For 1st Quadrant:
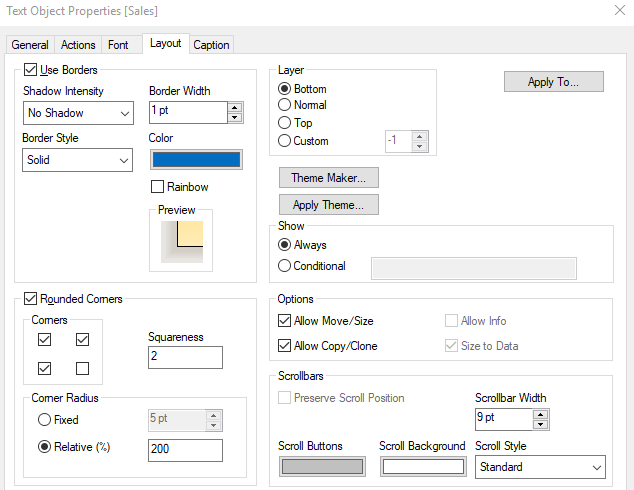
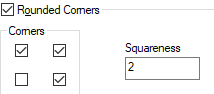
For the 1st quadrant, unchecked the 4th rounded corner option. Similarly, create other quadrants by deselecting the respective corners check box.
For 2nd Quadrant:
For 3rd Quadrant:
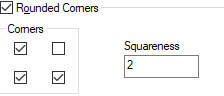
For 4th Quadrant:
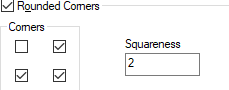
By changing the squareness of the rounded corners, other shapes like the star which is shown in the below snapshot with squareness set to 1 can be created as well.
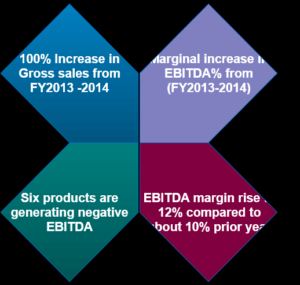
For descriptive information, we can show these types of different shaped objects and for the figures, we can either use text objects and resize them as per the business needs like the one used in the demo app or we can create a 2*2 grid container.
In conclusion
These techniques are quite useful for highlighting business insights effectively. If you are looking for Qlikview dashboard creation or more such visualization strategies with QlikView or Qlik sense or you yourself have any innovative visualization ideas like more custom shape visualizations, please contact us and we will deliver tailor-made solutions for you.
Find out about the services that we deliver in Qlik